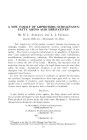
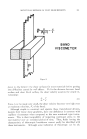
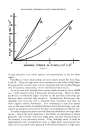
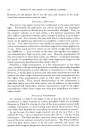
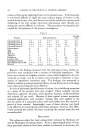
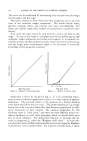
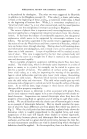
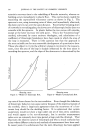
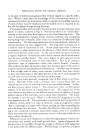
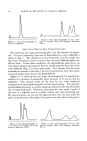
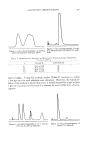
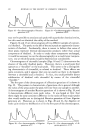
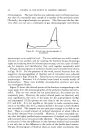
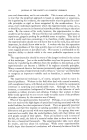
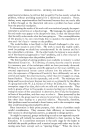
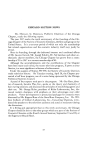
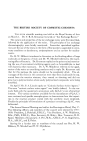
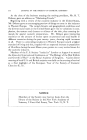
GAS-PARTITION CHROMATOGRAPHY 321 Figure 14.--Gas chromatography of rhodinol I. Figure 15.--Gas chromatography of rhodinol II. mixture. The over-all conclusion was that the analysis of the mixture was reasonably accurate. As far as quantitative analysis goes, the mixture of aldehydes was a rather easy case in that the peaks were completely resolved. In chroma- tographing a 1: 1: 1 mixture of methyl, ethyl and isopropyl esters of benzoic acid, Fig. 3 shows that the ethyl and isopropyl esters were not completely resolved from each other. This is a more critical test of the capabilities of the method. Figure 12 is a chromatogram from a 2: 1: 1 mixture of the ben- zoates and Fig. 13 is from a 1: 1: 2 mixture. In Table II, it can be seen that both the gross figures and the reproducibility were very good. In this case the starting materials were relatively pure. The isopropyl benzoate con- tained a trace of what was probably isopropyl alcohol the others contained no obvious impurities. Here again, it would be extremely difficult to analyze these mixtures by any other method. DIFFERENTIATION OF F•SSENTIAL OILS AND DETECTION OF ?tDULTERATION Gas chromatography can also be very useful for analysis of complex ma- terials whose constitution are not completely known. In these cases it Figure 16.--Gas chromatography of citro- Figure 17.--Gas chromatography of citronelllo nellol I. II.

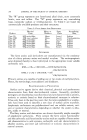
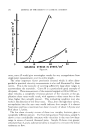
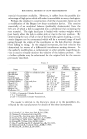
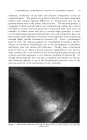
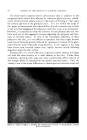
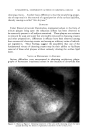
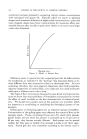
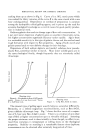
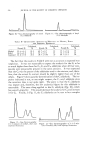
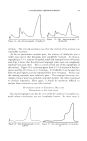
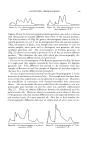
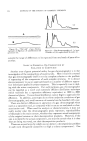
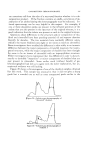
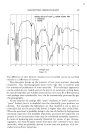
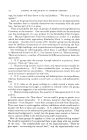
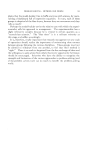
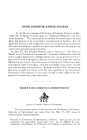
322 JOURNAL OF THE SOCIETY OF COSMETIC CHEMISTS Figure 18.--Gas chromatography of Reunion geranium oil I. Figure 19.--Gas chromatography of Reunion geranium oil II. may not be possible to associate each peak with a particular chemical entity, but this need not diminish the utility of the method. Figures 14 and 15 are chromatograms of two different samples of commer- cial rhodinol. The peaks to the left of the main peak are apparently charac- teristic of rhodinol. Incidentally, there is reason to believe that some of these peaks represent thermal decomposition products rather than actual components of rhodinol. In order to study these components unchanged, it would be necessary to run the chromatography at a much lower tempera- ture one at which the peaks would be flattened out considerably. Chromatograms of citronellol samples (Figs. 16 and 17) demonstrate the absence of the early rhodinol peaks. However, there is a small peak that appears as a "shoulder" on the main peak. This seems to be a distinguish- ing characteristic of citronellol, as related to rhodinol. These effects are quite consistent, and it appears that one can easily use them to distinguish between a citronellol and a rhodinol. In fact, one could probably detect adulteration of rhodinol with citronellol by means of the citronellol "shoulder." The first part of the chromatogram of a Reunion geranium oil is shown in Fig. 18. This pattern is characteristic of geranium oils in general although the ratios of the areas under the peak will vary from one sample to another. A chromatogram of another Reunion geranium oil is shown in Fig. 19, and it demonstrates different main peak ratios. It was hoped at first that there might be some consistent difference in the ratios of these major peaks that would enable one to distinguish Reunion geranium oil from Algerian geranium oil. However, as is shown in Figs. 20 and 21, the Algerian oil looks quite similar to the Reunion oil in the first part of the chromatogram. Figure 20.--Gas chromatography of Algerian geranium oil I. Figure 21.--Gas chromatography of Al- gerian geranium oil II.
Purchased for the exclusive use of nofirst nolast (unknown)
From: SCC Media Library & Resource Center (library.scconline.org)