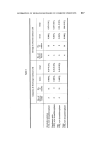
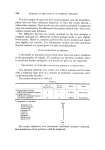
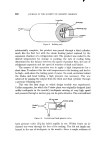
ESTIMATION OF HEXACHLOROPHANE IN COSMETIC PRODUCTS 21,0 FURTIlER EXPERIMENTS AND STATISTICAL ANALYSIS Homogeneous samples of soap and talc containing hexachlorophane were distributed to participating laboratories and the results obtained using the standardised method are given in Table III. Table III Labora- Soap (0.40 %) Talc (0.35 %) -i- tory 1 2 3 1 4 0.37 0.37 0.38 0.31 0.40 0.38 0.33 0.38 O.4O O.39 0.38 0.38 0,35 0.38 0.35 0.35 0.36 0.28 0.33 0.35 2 3 0.35 0.35 0.34 0.34 0.34 0.37 0.35 0.35 0.34 0.34 The results from laboratory 4 were definitely low, significantly so in the case of the talc, owing to a fault in the spectrophotometer. These results were therefore excluded from the statistical analysis (Table IV). Table IV Statistical analysis Mean Range Standard 95 % confidence deviation limits Soap 0.40• w/•v 0.38• 0.33-0.40% 0.0210 +_0.045 hexachlorophan e Talc 0.35 % w/w 0.35 • 0.33-0.37 % 0.0100 +_0.021 hexachlorophane Alcoholic solution 0.20 • 0.19-0.22 • 0.0074 _+ 0.016 0.20 % w/w hexachlorophane [ SPECIFICITY OF THE METHOD Other chlorinated bisphenols which might be present in cosmetic preparations are dichlorophane-2,2' methylene bis (4 chlorophenol) and bithionol-2,2' thio bis (4,6 dichlorophenol).

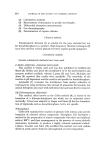
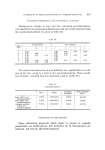
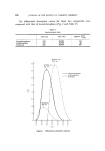
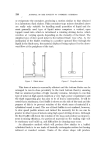
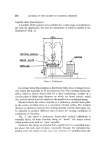
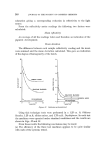
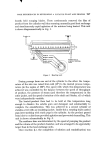
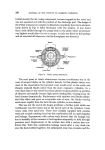
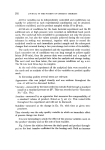
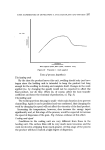
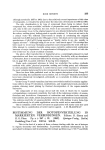
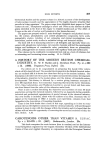
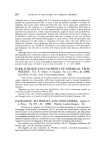
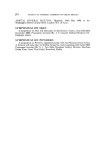
22O JOURNAL OF THE SOCIETY OF COSMETIC CHEMISTS The differential absorption curves for these two compounds were compared with that of hexachlorophane (Fig. 1 and Table V). Table V Spectroscopic data ttexachlorophane Dichlorophane Bithionol in•x nm 312 307 327 max cm- 1 32,050 32,600 30,500 approx. E 1 • lcm 144 32 157 160 - 140 -- 100 80 60 4O 2O 30,500 cm-I 327 nm 32,050 cm-I/["X 312 nm , , / \ 32,600cm? 307nm J , \ \ ,, i \\\ Hexachlorophane .... Dichlorophane Bi'l'hionol • • • o • • o o o g o ø g ø o ¸ o o o o trigur• i Differential absorption spectra
Purchased for the exclusive use of nofirst nolast (unknown)
From: SCC Media Library & Resource Center (library.scconline.org)