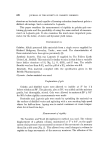
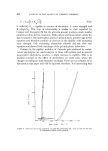
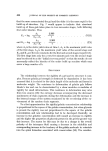
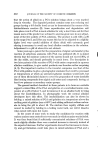
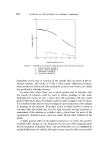
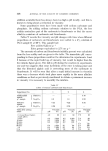
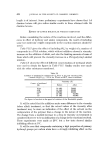
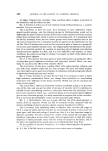
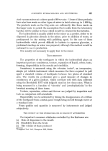
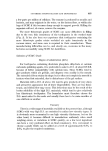
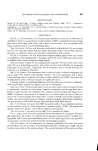
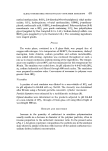
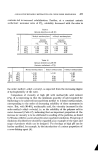
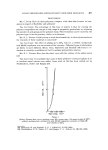
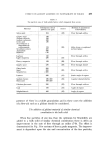
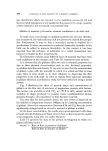
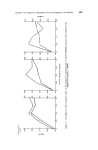
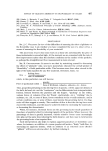
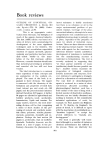
SOME APPLICATIONS OF RIGIDITY AND YIELD VALUES 431 Figure 3 20-- e/ 5 io 15 20 Gelafin, % W/W The effect of gelatine and glycerine concentrations on the rigidity of gelatine/ glycerine gels (25øC +_ 0.1 øC) Glycerine • a 0% b lO% o 20% d 40% e 60% G C (v} This empirical equation was valid for gels containing 4% to 15% gelatin and up to 40% w/w glycerin. The constants in this equation showed no simple relationship to the average molecular weight of the material. How- ever for each % w/w gelatin/glycerin ratio it was possible to calculate a linear relationship between rigidity and Bloom number of the gelatin J•"--= r q- kN (VI) where F=intercept on rigidity axis, k=slope and N =Bloom number. The elastic properties of dilute Laponite gels also show an approximately straight line relationship between the rigidity modulus and the concen- tration of Laponite. The presence of electrolytes affects the rigidity modulus of both gelatin/ glycerin and Laponite gels. For the former the relationship

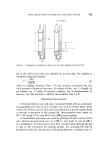
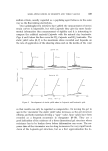
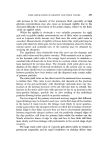
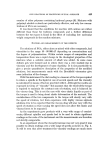
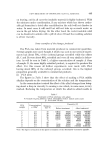
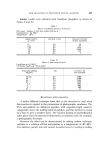
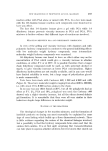
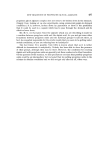
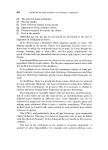
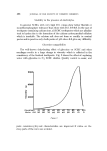
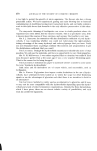
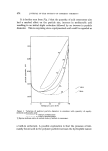
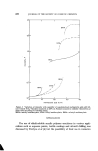
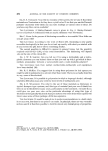
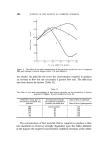
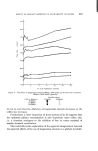
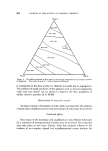
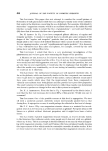
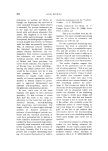
432 JOURNAL OF THE SOCIETY OF COSMETIC CHEMISTS is valid (4). G^: rigidity in absence of electrolyte. I =ionic strength and K=slope/G^. This type of relationship is similar to that reported by Cumper and Alexander (5) but the glycerin present produces much smaller numerical values for the constants. With cations and monovalent anions the sign is negative, but multivalent anions in general had a positive sign in the equation and therefore produce an increase in the rigidity with increasing ionic strength. Gels containing aluminium chloride did not obey this equation and showed both shrinkage of the gel and plastic behaviour. Changes in the rigidity modulus of Laponile gels produced by mono- valent electrolytes are small relative to those with gelatin and in general monovalent electrolytes produce a slight increase in rigidity. This is in marked contrast to the effect of electrolytes on yield value where the changes occurring are both dramatic and large. These are too complex to be discussed in this paper and will be reported elsewhere. It is interesting that 1500 IOOO 5oc 300 B 600 300 600 900 Sheor s•ress, Nm -• 10 Figure •t tqow curves of 3 • Laponite (A) and 8•o bentonite (B). ( els at rest for 0.5 rain in viscometer before curve plotted.
Purchased for the exclusive use of nofirst nolast (unknown)
From: SCC Media Library & Resource Center (library.scconline.org)