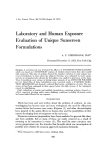
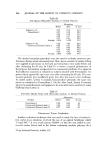
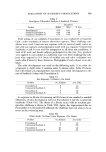
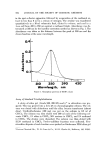
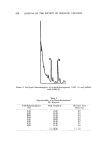
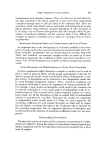
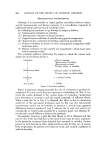
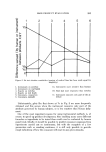
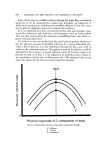
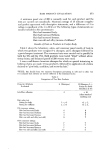
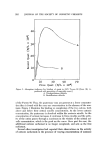
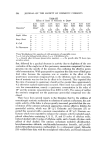
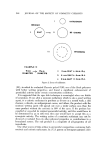
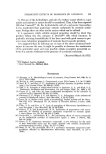
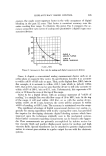
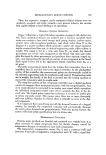
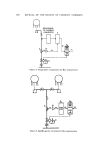
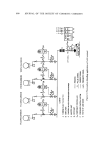
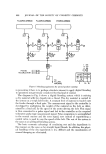
DETERMINATION OF TRACE COMPONENTS IN DYE 555 thin-layer plates, 0.5 mm thick. The thin-layer plates were migrated 10 cm with a solvent composed of 30% methanol, 1% glacial acetic acid in CHCla. Fractions 20-28 showed a single spot when viewed with long and short wave ultraviolet. This corresponded to the dominant spot of unpurified triethylrhod- amine, Rf0.35. Fractions 20-28 were pooled and diluted to 200.0 ml. A 50.0 mg % solution of unpurified triethylrhodamine in CHCla was prepared. Fifty microliters of this solution and 50/•1 of the pooled fractions were placed in a narrow band 5 cm in length on a 0.5-mm thick Brinkmann F254 plate. The plates were migrated as above. The triethylrhodamine bands (Rf0.35) were scraped from the plate and the dye was extracted from the silica with methanol. The methanol extracts were concentrated to 5.0 ml and read be- tween 650 and 450 nm in a 1-cm cell. To obtain the concentration of triethylrhodamine in the pooled fractions 20-28, two 90-ml aliquots were evaporated to dryness in vacuo and the resi- dues were weighed. Isolation o[ Triethylrhodamine [rom Rhodamine B Stearate One per cent solutions of the Rhodamine B sample and triethylrhodamine standard were prepared. A penciled line 10 cm long was placed 2 cm from the bottom of Brinkmann silica tlc plates. Aliquots (50 ./•1) of the standards and samples were applied along separate 10-cm lines (the applied sample streaks should be kept witlfin a width of 2 mm). After being air-dried, the plates were migrated 10.0 cm in 20% methanol in chloroform. If the triethyl- and tetra- ethylrhodamine are not clearly separated, the tlc plate should be air-dried and rerun in the same solvent. The triethylrhodamine bands were then scraped into 50-ml beakers, stirred with 10 ml of methanol, and filtered through a glass fiber filter,* 4.25 cm in diameter, in a Buchner funnel. After three more ex- tractions with 10-ml portions of methanol, samples were diluted to 50.0 ml with methanol. In the case of the standards, dilution was to 100.0 ml with methanol. Absorbance was read against a methanol blank at 532 nm. RESULTS AND DISCUSSION m-Diethylaminophenol and Phthalic Acid Figure 2 shows a gas-liquid chromatogram obtained when a sample con- taining 0.16% m-diethylaminophenol and 0.40'% phthalic acid were silylated and chromatographed as described above. While other components of the dye and silylating agent are in evidence, there is sufficient separation to obtain quantitation. To several samples of Rhodamine B stearate were added between 0.08 and 0.32% m-diethylamimophenol. The assay results are given in Table I. The linearity of glc response may be obtained from the peak height divided by the *934 AH, Reeve Angel & Co., Inc., Clifton, N.J. 07014.

556 JOURNAL OF THE SOCIETY OF COSMETIC CHEMISTS Figure 2. Gas-liqnid chromatography of m-diethylaminophenol, 0.1.6% (a) and phthalic acid, 0.40% (b) Table I Beproducibility of m-Diethylaminophenol Glc Response m-Diethylaminophenol Peak Height/% Deviation from (%) Mean (%) 0.32 15.30 0.7 0.32 15.10 0.7 0.24 15.32 0.8 0.24 15.40 1.3 0.16 15.60 2.6 0.16 15.10 0.7 0.08 15.10 0.7 0.08 14.50 4.6 • -- 15.20 •: 1.5
Purchased for the exclusive use of nofirst nolast (unknown)
From: SCC Media Library & Resource Center (library.scconline.org)