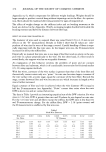
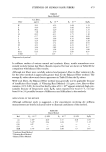
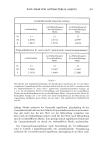
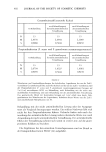
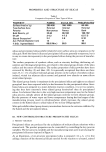
508 JOURNAL OF THE SOCIETY OF COSMETIC CHEMISTS Table VI Correlations Between Precipitated Silica Structure (% WCM and SI) and its Physical Properties STRUCTURE CORRELATION STRUCTURE CORRELATION PARAMETER PROPERTIES COEFFICIENT PARAMETER PROPERTIES COEFFICIENT % WCM 0.998 GLYCERINE ABSORPTION 0.920 SORBITOL ABSORPTION 0.967 MINERAL OIL ABSORPTION 0.996 BET SUR FACE AREA 0.895 AVG.
OIL PARTICLE DIAMETER 0.961 MERCURY INTRUSION POROSITY 0.985 GLYCERINE DEMAND INDEX 0.991 MINERAL OIL DEMAND INDEX 0.986 SORBITOL DEMAND INDEX 0,993 OIL ABSORPTION 0.999 GLYCERINE ABSORPTION 0.925 SORBITOL ABSORPTION 0.970 MINERAL OIL ABSORPTION 0.997 LOG STRUCTURE BET SURFACE AREA 0.926 INDEX AVG.
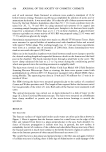
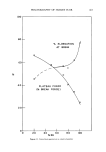
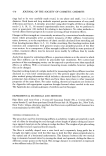
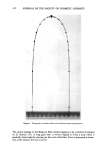
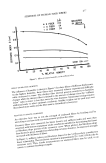
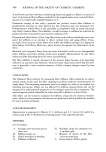
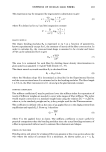
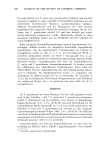
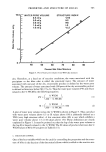
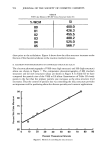
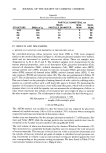
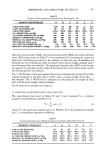
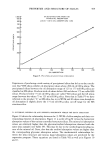
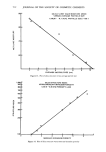
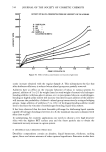
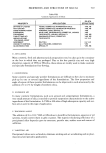
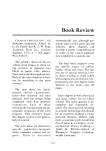
ABSORPTION PARTICLE DIAMETER 0.966 MERCURY INTRUSION POROSITY 0.995 GLYCERINE DEMAND INDEX 0.984 MINERAL OIL DEMAND INDEX 0,993 SORBITOL DEMAND INDEX 0.992 The calculations were carried out by the computer in which a correlation matrix is de- termined first. Then the program introduces the independent variable one by one. In -- step one, the variable • is introduced which has the strongest correlation with Y. At each consecutive step the independent variable is introduced by the program which has the best correlation coefficient. Table VI gives the correlation coefficient results when 'the silica % WCM and log structure index (dependent variables) were correlated with the various physical properties listed in Tables IV and V. Note in Table VI that the % WCM and log structure index parameters of silicas correlate very well with the physical properties of silicas samples A through F. The various mathematical equations relating the silica structure with its physical properties are listed in Table VII. These equations suggest that there is a very high degree of correlations between the silica structure and its physical properties. C. OIL ABSORPTION VERSUS STRUCTURE INDEX The structure (% WCM) of silica correlates very well with the oil absorption. Therefore the oil absorption value can be used for predicting the end-use properties of the precipitated silicas. A plot of log SI versus oil absorption is shown in Figure 9. Table VII Mathematical Relationship Between the Precipitated Silica Structure and Its Physical Properties % WCM LOG SI % WCM LOG SI % WCM LOG SI % WCM LOG SI % WCM LOG SI % WCM LOG SI % WCM LOG SI (SILICA STRUCTURE} (STRUCTURE INDEX} (Sl LICA STRUCTURE} (STRUCTURE INDEX) (SILICA STRUCTURE} (STRUCTURE INDEX) (Sl LICA STRUCTURE} (STRUCTURE INDEX) (STRUCTURE) (STRUCTURE INDEX) (STRUCTURE) (STRUCTURE INDEX) (STRUCTURE) (STRUCTURE INDEX) = 0.23 {OIL ABSORPTION) + 39.0 = 0.012 {OIL ABSORPTION) + 3.93 = 0.38 {GLYCERINE ABSORPTION) + 25.7 = 0.019 {GLYCERINE ABSORPTION) + 3.24 0.26 (MINERAL OIL ABSORPTION) + 33.0 = 0.013 (MINERAL OIL ABSORPTION) + 3.63 = 0.28 (SORBITOL ABSORPTION) + 32.4 = 0.014 {SORBITOL ABSORPTION) + 3.59 = 0.21 {SURFACE AREA) + 50.3 = 0.011 (SURFACE AREA) +4.47 = -4.7 {AVG. PARTICLE SIZE) + 100.1 = -0.24 {AVG. PARTICLE SIZE) + 7.08 = 6.7 {MERCURY INTRUSION POROSITY) + 47.0 = 0.34 {MERCURY INTRUSION POROSITY) + 4.33

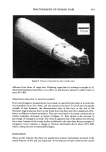
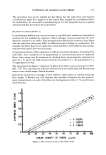
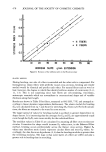
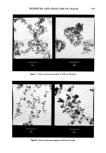
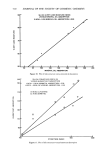
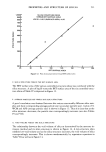
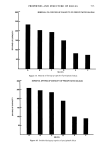
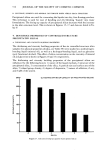
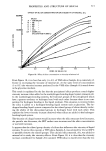
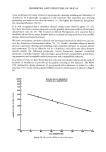
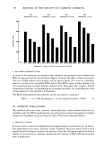
PROPERTIES AND STRUCTURE OF SILICAS 509 1,000 9OO 8OO 700 600 5OO 40( 30( 2O0 100 70 -- SILICA STRUCTURE INDEX (SI) -- VERSUS OIL ABSORPTION -- LOG SI • 0.012 (OIL ABSORPTION) +3.93 I i i i I i I 90 110 130 150 170 190 210 OIL ABSORPTION Figure 9. Plot of silica structure versus oil absorption Experience of producing a wide variety of precipitated silicas has led us to the conclu- sion that VHS silicas exhibit oil absorption values above 200 ml oil/100 g silicas. The precipitated silicas between the oil absorption range of 125 to 175 ml/100 g silica are classified as MS silicas. Products with oil values below 200 and above ! 75 are called HS silicas. Products below 75 ml oil/100 g silica are called VLS silicas and the LS silicas range between the values 75 to 125 ml oil/100 g silica. Note that in Table IV we have referred to the product "C" as MS silica due to its WCM and SI values even though its oil absorption is slightly above the 175 ml oil/100 g silica cut-off range for the MS structure silica. D. GLYCERINE, MINERAL OIL AND $ORBITOL ABSORPTION VERSUS THE SILICA STRUCTURE Figure 10 shows the relationship between the % WCM of silica samples and their cor- responding mineral oil absorptions. Figure 11 is a plot of log SI versus the humectant absorption values of the various controlled-structure silicas. The mineral oil absorption values are relatively higher than the glycerine/sorbitol absorptions obtained with the same silica samples (see Table IV). This may be due to the nonhydrogen-bonding na- ture of the mineral oil. Note, also that the sorbitol absorption values are higher than the corresponding glycerine absorption values. The mathematical relationships be- tween the silica structure and various liquid absorption values are predicted by the regression program. These equations are listed in Table VII as well as in Figures 10 and 11.
Purchased for the exclusive use of nofirst nolast (unknown)
From: SCC Media Library & Resource Center (library.scconline.org)