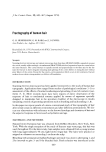
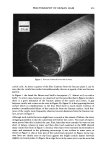
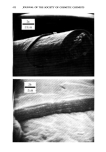
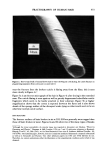
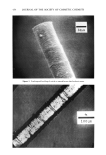
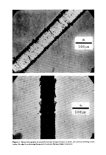
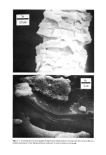
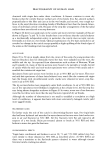
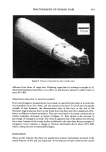
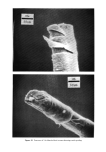
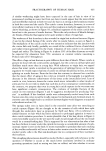
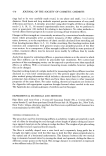
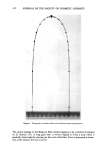
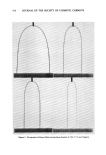
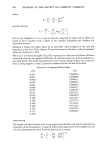
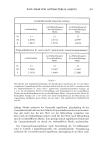
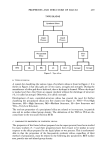
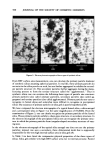
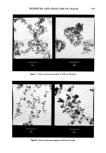
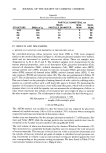
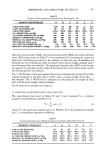
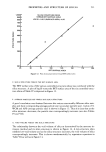
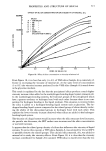
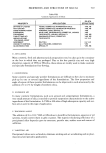
474 JOURNAL OF THE SOCIETY OF COSMETIC CHEMISTS Figure 3. Photographs of balanced fibers having linear densities of 118, 71, 55 and 32/xg/cm

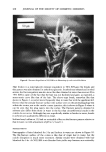
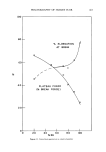
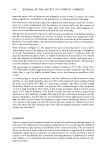
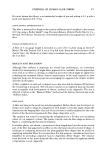
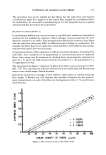
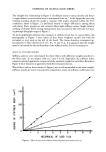
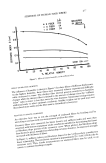
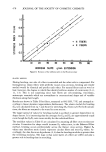
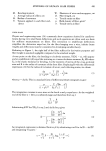
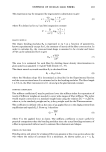
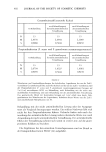
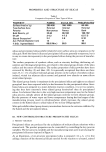
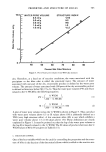
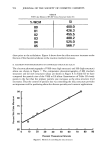
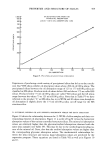
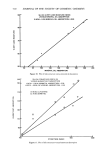
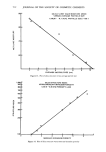
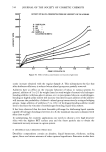
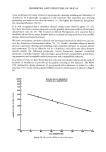
STIFFNESS OF HUMAN HAIR FIBERS 475 The straight-line relationship in Figure 2 of stiffness index to linear density and hence to approximate cross-sectional area is anticipated from eq 7 in the Appendix since the bending modulus should be nearly a constant. The scatter of points within the 95% confidence limits in Figure 2 is attributed mainly to shape differences among fibers with flatter fibers giving low and rounder fibers high stiffness values. Slight inelastic yielding of thinner fibers during measurement may account for the intercept not pass- ing through the graph origin in Figure 2. To more graphically illustrate the variation in stiffness from fine to coarse fibers, the photographs in Figure 3 were taken of four fibers weighted equally and with the proximal or root ends at the left of the hook. The linear densities correspond ap- proximately to fiber diameters of 107, 83, 73 and 55 •. It is apparent that the weight must be increased for the thickest fiber if the stiffness index D is to be measured. EFFECT OF ATTACHED WEIGHTS Stiffness indices were determined for three fibers with different weights attached to the fiber ends. In accordance with eq 7 and 9 in the Appendix, the stiffness index squared is plotted against the reciprocal of the attached weight for each fiber. Results in Figure 4 show linearity in agreement with theoretical prediction. When fibers such as those shown in Figure 3 are not all measurable at the same weight, stiffness results are more conveniently compared in terms of stiffness coefficients (see x z o 1.50 1.00 .50 I 2 .9 4 5 6 7 B RECIPROCAL OF LOAD (I/g) Figure 4. Effect of load on the stiffness index using functions indicated by eq 3
Purchased for the exclusive use of nofirst nolast (unknown)
From: SCC Media Library & Resource Center (library.scconline.org)