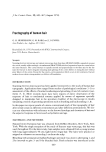
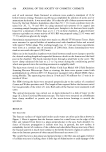
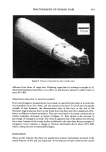
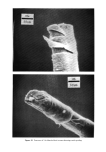
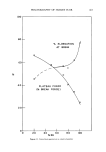
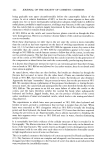
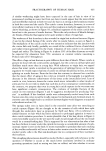
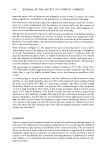
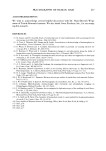
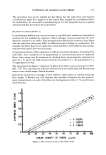
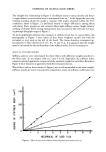
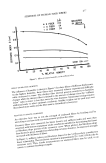
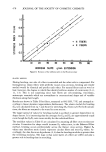
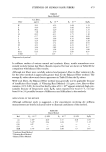
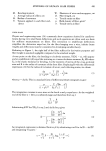
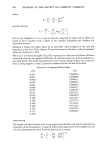
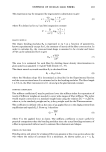
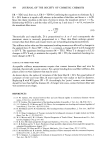
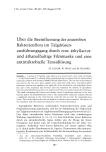
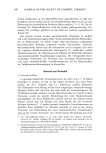
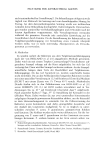
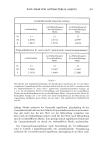
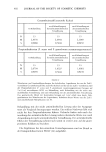
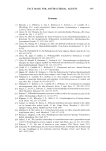
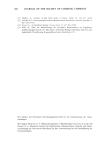
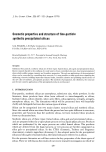
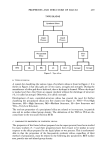
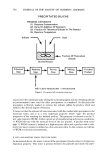
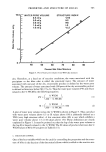
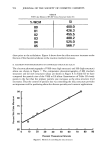
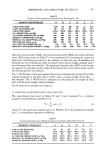
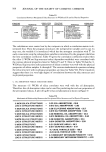
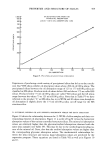
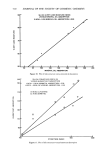
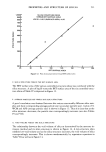
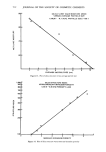
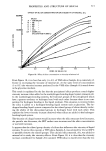
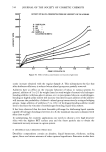
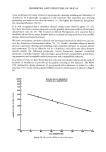
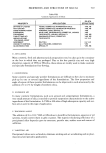
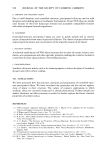
PROPERTIES AND STRUCTURE OF SILICAS 511 1,000 900 800 700 600 500 400 300 -- 200 - 100 25 SILICA STRUCTURE INDEX VERSUS BET SURFACE AREA • I I I I I I I 50 75 100 125 150 175 200 BET SURFACE AREA Figure 12. Plot of structure index versus BET surface area E. SILICA STRUCTURE VERSUS THE BET SURFACE AREA The BET surface area of the various controlled-structure silicas was correlated with the silica structure. A plot of log SI versus the BET surface area of the six controlled-struc- ture silicas of Table IV is depicted in Figure 12. F. AVERAGE PARTICLE SIZE VERSUS THE SILICA STRUCTURE A good correlation was obtained between the various structurally different silica sam- ples and their corresponding average particle size (secondary particle size). A plot of % WCM and APS (average particle size) is shown in Figure 13. Thus it is clear that as the silica structure decreases, the particle size correspondingly increases (see also Tables IV and VII). G. VOID VOLUME VERSUS THE SILICA STRUCTURE The relationship between the void volume of silica as determined by the mercury in- trusion method and its silica structure is shown in Figure 14. A low-structure silica exhibits low-void volume and as the silica structure increases, the void volume of silica correspondingly increases. This is shown mathematically by regression equations in Table VII as well as in Figure 14.

512 JOURNAL OF THE SOCIETY OF COSMETIC CHEMISTS 90 80 70 60 SILICA % WET CAKE MOISTURE (WCM) VERSUS AVERAGE PARTICLE SIZE 3 4 5 6 7 8 9 10 AVERAGE PARTICLE SIZE {/•m) Figure 13. Plot of silica structure versus average particle size 1,000 90( 801 70( 6O( 500 400 300 lO( sILICA STRUCTURE INDEX VERSUS MERCURY INTRUSION POROSITY LOG Sl = 0.34 (HGI POROSITY) +4.33 Jl I I I I 1 2 3 4 5 6 MERCURY INTRUSION POROSITY Figure 14. Plot of silica structure versus mercury intrusion porosity
Purchased for the exclusive use of nofirst nolast (unknown)
From: SCC Media Library & Resource Center (library.scconline.org)