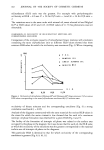
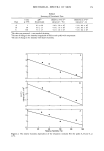
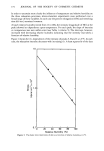
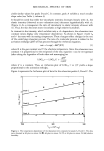
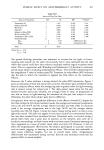
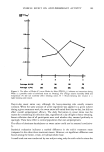
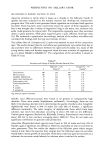
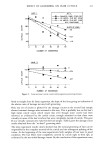
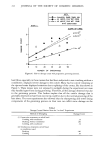
MECHANICAL SPECTRA OF SKIN 175 yields similar values for peaks B and C. In contrast, peak A exhibits a much smaller slope value (see Table 1, column 4). It should be noted that while the viscoelastic intensity decreases linearly with r.h., the elastic intensity (observed at zero relaxation time) decreases logarithmically with r.h. (Figure 3). As a consequence the ratio of viscoelastic to elastic intensity decreases with r.h. Thus, the skin becomes more viscoelastic at high relative humidities. In contrast to the intensity, which exhibits only a r.h. dependence, the relaxation time constant values display only temperature dependence. As shown in Figure 1 both •'B and •.c decrease with increasing temperature. These changes reflect changes in the rate of the underlying relaxation process. The rate of a molecular process is related to the activation enthalpy (AH*) of that process through the Arrhenius equation, rate = k exp(--AH*/RT) (2) where R is the gas constant and T the absolute temperature. Since the relaxation time constant r is proportional to the reciprocal of the rate, equation 1 can be re-expressed (after taking the logarithm of both sides and rearranging) as AH* LOG•0 r = LOG•0 k' + -- (3) 2.3RT where k' is a constant. Thus, an Arrhenius plot of LOG•0 ß vs 1/T yields a slope proportional to the activation enthalpy. Figure 4 represents the Arrhenius plot of data for the relaxation peaks A, B and C. The o Ioo Peak C Peak B • -- , , , J I i I 320 1/T x (105/OK) Figure 4. The temperature dependence of the relaxation time constants for peaks A, B and C. The data were obtained at 90 plus or minus 5% (0), 60 plus or minus 5% (O) or 40 plus or minus 5% (A) relative humidity. 34( Peak A ,,•,

176 JOURNAL OF THE SOCIETY OF COSMETIC CHEMISTS data for each peak were fit to a straight line using a least squares technique to yield the slope plus or minus one standard deviation. Within experimental error, Peak A shows a zero activation enthalpy. In contrast, peaks B and C exhibit m_uch larger AH* values of 9.4 plus or minus 2.5 and 7.5 plus or minus 1.7 Kcal/mole, respectively. The data of Figure 4 represent experiments done at three widely separate conditions of relative humidity. In each case the data at one particular r.h. fit, within error, the total data for each peak. Thus, the r values exhibit no dependence upon r.h. The results are summarized in Table I. DISCUSSION Based upon the temperature and relative humidity dependences of the intensity and time constant of each peak, molecular mechanisms can be proposed for the underlying relaxation process. The two peaks characterized by large •' values (peaks B and C) exhibit similar temperature and relative humidity dependencies. In both instances the time constants depend only on the temperature while the intensities vary only with relative humidity. Our results are similar to those of Gibbs et al. (14) who investigated the dynamic viscosity of gels composed of the mucopolysaccharide hyaluronic acid and water by measuring the temperature dependence of the viscosity over a frequency range of 0.02 to 1.67 Hz. Their results yielded an AH* of 5-10 Kcal/mole, a value typical of polymeric rate processes in which the breaking and formation of hydrogen bonds predominate. The fact that both the AH* and time range (reciprocal of the frequency--0.6 to 500 sec.) of the gel experiments correspond with the values reported here for peaks B and C, suggest that similar mechanisms are at work. We believe that the relaxation mechanisms responsible for peaks B and C involve the movement of chain segments of the mucopolysaccharide molecule. The movement of the chain in a water swollen gel will necessitate the breaking and reformation of H bonds, giving rise to AH * values of about 5 Kcal/mole. The involvement of the gel matrix in the viscoelastic response of skin is further supported by experimental work with human skin and tendon. Finlay (11) found that human skin exhibited viscoelastic responses to small, periodic displacements over a frequency range of 0.04 to 1 Hz, similar to that previously noted for mucopolysaccha- ride-water gels. Therefore, Finlay concluded that the gel was responsible for the viscoelasticity of skin. Note that the time range of Finlay's experiment (reciprocal of the frequency-1 to 250 sec) corresponds to the time range reported here. Cohen et al. (15) measured the isochronal temperature dependence of creep in human tendon within the time range of 20 to 200 sec. The results of these experiments showed that the creep process at low elongations (2%) was characterized by AH * of 12 plus or minus 3 Kcal/mole. The AH * value was similar to that obtained for the shearing of a mucøpølysaccharide-water gel, leading the authors to conclude that stretching of skin resulted in alignment of collagen fibers and subsequent shearing of the gel matrix. The AH * and time range of the creep experiments are nearly identical to the values for peaks B and C reported here. In addition, the extent of elongation in each experiment is similar. Thus, in light of the striking similarities between the results of experiments with human skin and tendon and the results reported here, it appears highly likely that the
Purchased for the exclusive use of nofirst nolast (unknown)
From: SCC Media Library & Resource Center (library.scconline.org)