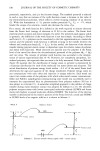
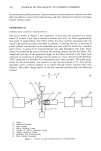
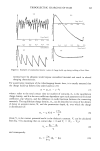
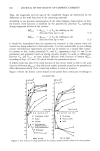
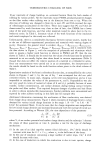
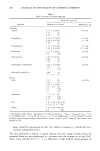
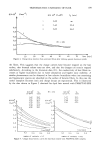
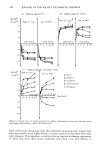
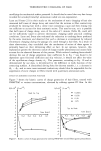
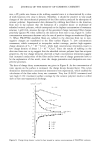
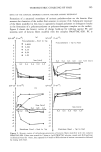
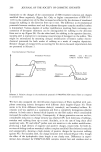
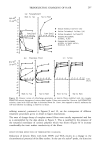
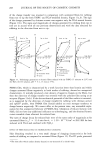
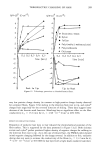
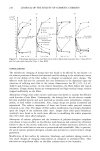
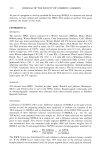
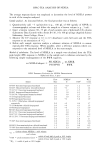
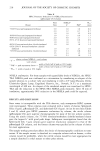
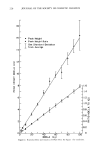
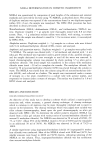
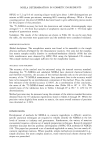
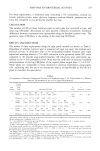
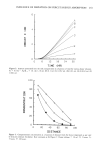
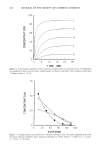
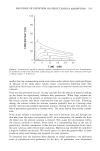
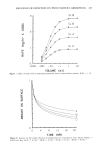
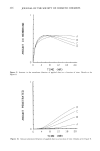
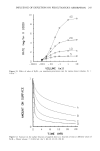
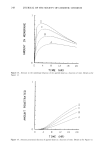
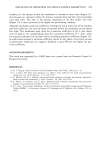
244 JOURNAL OF THE SOCIETY OF COSMETIC CHEMISTS constant except for K, the transport coefficient, which varied from 0.2 to 0.8 hr-• In the second series, K was set at 0.6 hr- • and the ratio of Ki to K_i, which represents a stratum corneum/vehicle partition coefficient, varied from 5 to 40. The effect of transfer coefficient (K) on the relationship between maximum flux and donor volume is shown in Figure 7. Under infinite dose conditions (large donor volume) the flux is the steady-state value. At very small donor volumes, significant reduction in the value of the maximum flux is found. This is due to depletion. The decrease in penetration rate at small donor volumes takes place to more or less the same extent regardless of the value of K. For example, the maximum penetration rate following application of 0.0032 ml is between 35 and 36% of the steady-state value in every case. Among the infinite dose systems, penetration rate is essentially proportional to K and approximately the same dependence of penetration rate on K is found under finite dose conditions. The time dependence of the amount of permeant found on the surface, in the stratum corneum, and in the sink for a donor volume of 0.0032 ml is represented in Figures 8-10, which should be looked at together. These three locations account for at least 98% of the permeant at all times. In the figures, amount is represented as the fraction of the applied dose so that it is possible to get an idea of major distributional patterns by inspection. (The dose is, of course, the same for all of the simulations.) Following application, the amount in the donor (Figure 8) drops in all cases, but most rapidly for the system which has the highest value of K. The total amount within the stratum corneum is largest at early times when the value of K is highest (Figure 9). This is because uptake by the sections of the stratum corneum farthest from the donor is limited by transport within the membrane and rapidity of transport is related to K. After a time, because depletion of permeant occurs most rapidly from systems with the higher K values, the curves in Figure 9 cross each other so that, past 12 hours in the examples shown, the amount in the stratum corneum is inversely related to K. Although peak stratum corneum accumulation takes place at different times, the peak amount is essentially independent of K. Figure 10 shows that the amount penetrated at all times is positively related to the value of K. Figure 11 depicts the way in which changes in the K•/K_i ratio affect maximum penetration rate at different donor volumes. With large donor volumes, the rate (steady state) is proportional to Ki/K_•. Although the rate decreases at small donor volumes in all cases, the degree of reduction is disproportionally greater at high partition coef- ficient values. For example, with a donor volume of 0.0032 ml, the maximum pene- tration rate for the system with a partition coefficient of 40 is only twice that for the system with a partition coefficient of 5. It is also instructive to compute the ratio of penetration rate with a donor volume of 0.0032 to that at steady state for each partition coefficient. With partition coefficients of 5, 10, 20, and 40, this ratio is 0.51, 0.35, 0.22, and 0.13, respectively. As the partition coefficient is increased, the rate of penetration following application of very small donor volumes becomes a progressively smaller fraction of the rate under steady-state conditions. Further insight may be obtained from Figures 12 to 14, which show how the amount of permeant on the surface, in the membrane, and in the sink changes with time for a donor volume of 0.0032 mi. Again, amounts in these figures are expressed as a fraction of the applied dose. As the partition coefficient is increased, there is a greater

INFLUENCE OF DEPLETION ON PERCUTANEOUS ABSORPTION 245 0.8 0.6 0.4 I I I I I I I I I I .0001 .001 .01 .1 1 10 VOLUME (ml) Figure 7. Effect of value of K on maximum penetration rate for various donor volumes. K•/K_• = 10. z ^ B c O I I I I I I I I I I 4 B 12 16 20 TIME (HR) Figure 8. Amount on the surface (fraction of applied dose) as a function of time. Donor volume 0.0032 ml. Key: (A) K = 0.2 hr-t (B) K = 0.4 hr-t (C) K = 0.6 hr -•' (D) K = 0.8 hr -•
Purchased for the exclusive use of nofirst nolast (unknown)
From: SCC Media Library & Resource Center (library.scconline.org)