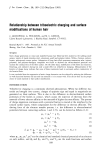
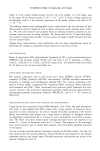
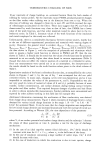
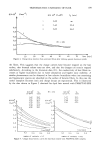
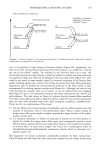
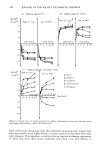
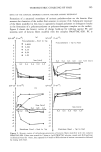
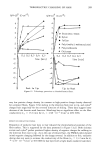
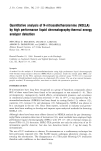
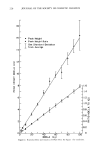
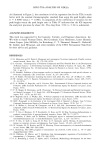
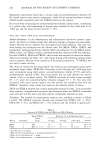
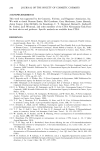
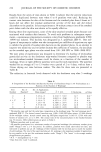
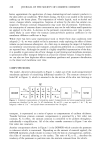
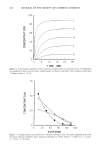
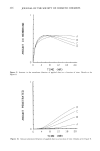
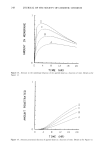
246 JOURNAL OF THE SOCIETY OF COSMETIC CHEMISTS ILl Z ,•- ILl •.- Z Z A B • I I I I I I I I I I O 4 8 12 16 20 TIME (HR) Figure 9. Amount in the membrane (fraction of applied dose) as a function of time. Details as for Figure 8. 0 4 8 12 16 20 TIME (HR) Figure 10. Amount penetrated (fraction of applied dose) as a function of time. Details as for Figure 8.

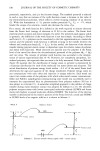
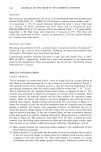
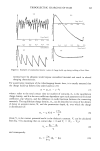
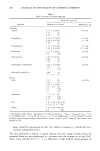
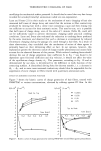
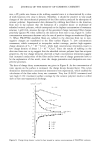
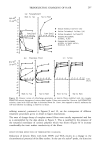
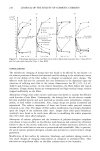
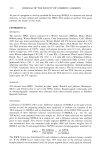
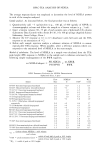
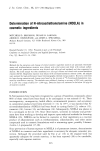
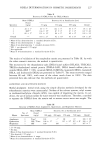
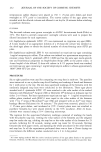
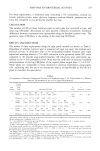
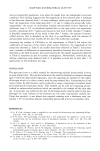
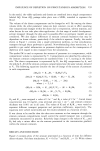
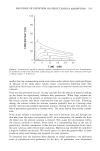
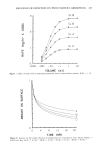
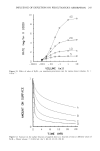
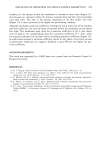
INFLUENCE OF DEPLETION ON PERCUTANEOUS ABSORPTION 247 10 4O 2O • I I I I I I I I I I .0001 .001 .01 .1 1 10 VOLUME (ml) Figure 11. Effect of value of Ki/K_ I on maximum penetration rate for various donor volumes. K = 0.6 hr -i. z B TIME 12 (HR) 18 B Figure 12. Amount on the surface (fraction of applied dose) as a function of time at different values of Ki/K_ I. Donor volume = 0.0032 mi. (A) 5. (B) 10. (C) 20. (D) 40.
Purchased for the exclusive use of nofirst nolast (unknown)
From: SCC Media Library & Resource Center (library.scconline.org)