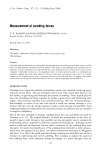
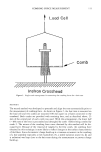
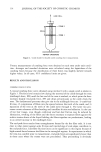
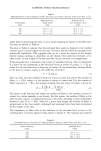
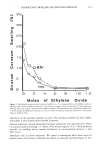
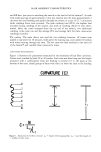
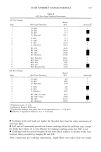
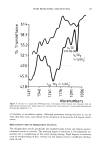
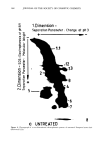
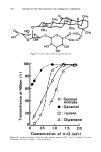
HAIR ASSEMBLY CHARACTERISTICS 145 and reweighed. The percent diameter change was computed from the percent weight changes by the relationship Y = 0.44 X, calculated from data by Stam and cowork- ers (9). STIFFNESS A fiber of 5-cm gauge length was extended at a rate of 0.05 cm/min with chart speed at 12.7 cm/min using an Instron © Model TM with Tension Cell A set at 10 grams full scale load. From the linear portion of the charted tracing, the elastic slope was esti- mated as grams per mm extension (H) of the 5-cm fiber. Each stiffness value was generally an average from 15 fibers. For dry stiffness the RH was 60 ___ 5%. Wet stiffness measurements were made in deionized water after soaking the fibers for one hour. RESULTS AND DISCUSSION RELATIONSHIPS BETWEEN HAIR COMBING BEHAVIOR AND SINGLE FIBER PROPERTIES In the previous paper (1) it was hypothesized that changes in combing behavior could be described by six primary single-fiber properties measured under conditions relevant to combing behavior: K(Combing Ease) = f(Fs,Fk,S,C,D,E) (2) Equation (2) suggests that static friction (Fs), kinetic friction (Fk) , stiffness (S), curva- ture (C), diameter (D), and static charge (E) are all relevant to combing behavior. Furthermore, if one considers any particular consumer's hair described by K (combing ease), then the change produced by treatment of this hair is represented by equation 3. combing ease = -(N 1 ß Fk) -- (a 2 ß F s) - (a 3 ' E) + (nl' S) + (n2 ß D) - (N4' C) (3) Thus this hypothetical expression describes the effects of a treatment on combing be- havior of hair and suggests that combing behavior is influenced primarily by changes in fiber friction, static charge, and fiber curvature, with smaller contributions (small n) from fiber stiffness and diameter. In this study several experiments were conducted to test the effects of single-fiber prop- erties on combing behavior. Combability measurements were made by the method of Garcia and Diaz (3). Peak combing load (PCL), the highest load (in grams) during the combing of a swatch, and work of combing (ACL) in gm-cm were the quantitative criteria for combing behavior. Specifically the average PCL and ACL from three consec- utive combing runs of 5 to 10 tresses was employed. The actual combing data were developed in seven separate experiments and are summa- rized in Tables I and II. Each experiment of Table I was analyzed by both parametric and nonparametric statistical tests. The statistical conclusions are generally similar, but in the few instances where the analyses provide differences the nonparametric tests were the more sensitive. This is probably because of unequal variances or distributions that are not normal, necessary assumptions for ANOVA but not for the nonparametric tests. The ACL values of Table II were analyzed only by a nonparametric statistical test.

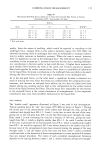
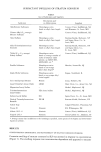
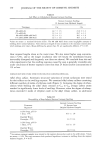
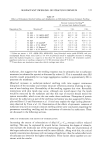
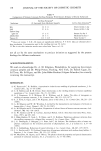
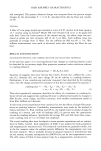
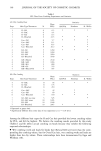
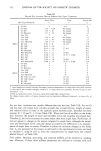
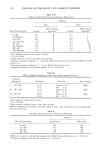
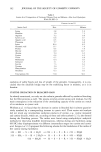
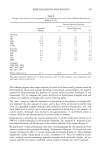
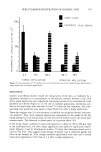
146 JOURNAL OF THE SOCIETY OF COSMETIC CHEMISTS Table I PCL Data From Combing Experiments and Statistics (A) Dry Combing Data Expt. Hair Type/Treatment Mean N PCL{ Statistics ANOVA Friedman K. Wallis 1 O-Oil 1 O-SAC 1 O-SLS 1 O-Bleached 2 Can- Oil 2 Can- SAC 2 Cau-SLS 2 Can- Bleached 3 KI-Oil 3 KI-SAC 3 KI-SLS 3 KI-Bleached 4 KII- Bleach 4 KII-SAC 4 KII-SLS 4 KII-Oil 4 KII-Bleach-Oil 6 6.3 * * 6 9.4 6 11.3 6 22.5 * * 8 5.7 * * 8 13.1 8 14.5 8 26.2 * * 5 1260 * * 5 326O 5 295O 5 334O 5 2140 * * 5 1036 5 899 5 522 5 507 (B) Wet Combing Mean Expt. Hair Type/Treatment N PCL• Statistics ANOVA Friedman K. Wallis 5 O-SAC 8 56 5 O-SLS 8 175 5 O- Bleached 8 210 6 Can-SAC 5 42 6 Cau-SLS 5 69 6 Can- Bleached 5 150 7 KI-SAC no rinse 5 525 7 KI-SAC rinse 10 1265 7 KI-SLS 10 1180 7 KI- Bleached 10 2015 -• Expressed as grams load. * Significantly different from other data of this experiment at tx = 0.05 level. Among the different hair types the O and Can hair provided the lowest combing values for PCL, and KI the highest. We believe the combing results provided by this study (Tables I and II) reflect actual combing on heads because they exhibit the following expected relationships: ß Wet combing work and loads for kinky hair (KI and KII) are lower than the corre- sponding dry combing values, but for O and Can hair, wet combing work and loads are higher than the dry values. These relationships have been demonstrated by Epps and Wolfram (10).
Purchased for the exclusive use of nofirst nolast (unknown)
From: SCC Media Library & Resource Center (library.scconline.org)