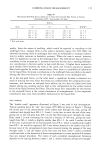
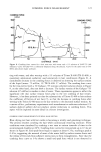
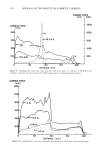
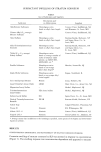
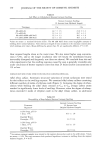
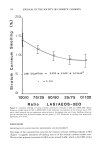
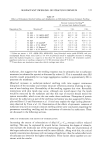
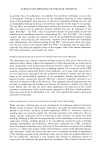
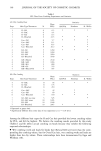
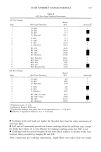
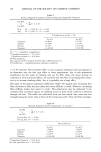
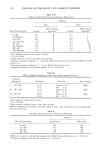
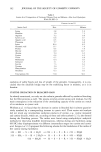
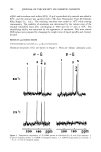
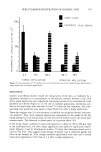
HAIR ASSEMBLY CHARACTERISTICS 147 Table II ACL Data From Combing Experiments (A) Dry Combing Meant Expt. Hair Type/Treatment ACL Statistics• 1 O-SAC 51.1 1 O-OIL 72.3 1 O-SLS 74.5 1 O-Bleached 105.7 2 C-Oil 73.3 2 C-SAC 76.4 2 C-SLS 101.8 2 C- Bleached 140.6 3 KI-Oil 9635 3 KI-SAC 23099 3 KI-SLS 21628 3 KI-Bleached 22168 4 KII-Bleached 19093 4 KII-SAC 10246 4 KII-SLS 7896 4 KlI-Oil 5524 4 KII-Bleached-Oil 5328 (B) Wet Combing Mean:• Expt. Hair Type/Treatment ACL Statistics• 5 O-SAC 487 5 O-SLS 1089 5 O-Bleached 1918 6 C-SAC 289 6 C- SLS 441 6 C-Bleached 1043 7 KI-SAC (no rinse) 483l 7 KI-SAC (rinse) 9499 7 Ki-SLS 10727 7 KI-Bleached 18592 +• Expressed as gm cm work. + :• Analysis by Kruskal Wallis test. * Significantly different from other data of this experiment at ct = 0.05 level. • Indicates no significant difference at ot -- 0.05 level. © Combing work and loads are higher for bleached hair than for other treatments of each hair type. © SAC and oil treatments provide the lowest combing values for each hair type, except for kinky hair where oil is very effective for making combing easier but SAC is not. © Combing loads for several samples of hair from black subjects in another study were between those provided by samples KI and KII. After completing the combing experiments, single fibers were taken from the tresses

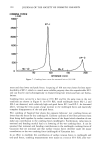
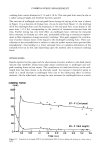
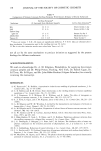
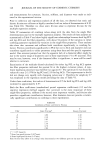
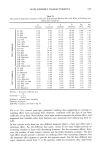
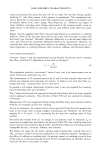
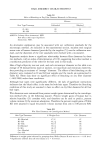
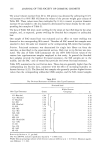
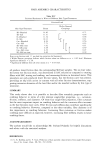
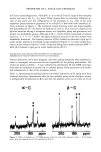
148 JOURNAL OF THE SOCIETY OF COSMETIC CHEMISTS and measurements for curvature, friction, stiffness, and diameter were made as indi- cated in the experimental section. Prior to collection and regression analysis of all the data, we observed that static and kinetic friction are collinear or highly correlated with an index of determination of 0.95 (see Table III). Therefore we chose static friction alone to represent friction for the multiple regression analyses. Table IV summarizes all combing values along with the data from the single fiber determinations used in the multiple regression analyses. The results of these analyses are summarized in Table V and show highly significant relationships between both log PCL and log ACL and the fiber properties, with about 94 percent of the variation in either combing parameter explained by variation in the single-fiber properties. These analyses also show that curvature and stiffness both contribute significantly to combing be- havior. Friction contributes significantly to PCL but not to ACL and diameter does not contribute significantly to either parameter using these data and this specific regression model. One reviewer pointed out that the apparent lack of a diametral effect might be due to the narrow range of diameters used in these experiments (71 to 95 microns). This may be true however, even if the diametral effect is significant, it must still be small relative to curvature. Examination of the residuals (found-calculated) for either log PCL or log ACL against the fiber properties indicated the poorest fit at the highest curvature values. A non- linear regression procedure was therefore run against C n. The optimum fit was found for values ofn near 2 (1.978 for log PC1 and 2.05 for log ACL). The improvement in the fit did not change very rapidly with changing values near 2. Therefore for simplicity C 2 was employed in the regression model providing the data of Table VI. Under these conditions, the indices of determination (C 2) for both log PCL and log ACL increased to approximately 0.97. Both the Beta coefficients (standardized partial regression coefficients) (12) and the stepwise regression method suggest that curvature is the most important of these single-fiber properties, stiffness is the second most important variable, and friction also provides a significant contribution however, fiber diameter does not provide a statisti- cally significant contribution to combing in these experiments. Table III Correlation of Static and Kinetic Friction X Y Fiber Static Friction* Kinetic Frictions A 4.80 4.40 B 2.30 1.70 C 2.82 2.10 D 2.31 1.72 E 1.49 1.19 F 4.70 3.50 G 2.80 2.11 r 2 = 0.95 linear fit. * From low-speed friction (0.02"/min). S From high-speed friction (5.0"/min). Each friction value above is an average value determined at two different spots on the same fiber.
Purchased for the exclusive use of nofirst nolast (unknown)
From: SCC Media Library & Resource Center (library.scconline.org)