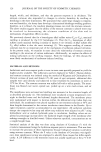
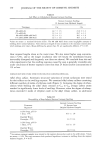
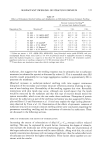
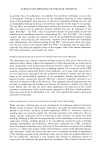
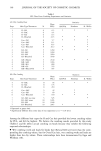
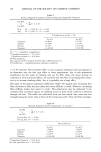
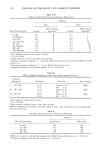
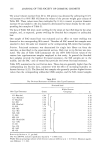
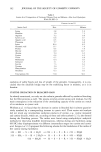
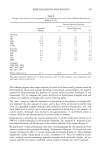
HAIR ASSEMBLY CHARACTERISTICS 149 Table IV Data Used for Regression Analyses to Discover Relationships Between Force and Work of Combing and Other Fiber Properties pt C S D log log Friction Curvature Stiffness Diameter PCL ACL O-Oil 0.24 0.00 23.10 86.00 0.80 1.86 O-SAC 0.28 1.60 23.10 86.00 0.97 1.71 O-SLS 0.45 1.60 23.10 86.00 1.05 1.87 O-Bleached 0.48 1.50 22.10 86.00 1.36 2.02 Cau-Oil 0.22 0.00 18.50 71.00 0.76 1.87 Cau-SAC 0.25 2.50 18.50 71.00 1.12 1.88 Cau-SLS 0.31 2.70 18.50 71.00 1.16 2.01 Cau-Bleached 0.49 2.60 17.80 71.00 1.42 2.15 KI-Oil 0.21 17.80 14.10 76.00 3.10 3.98 KI-SAC 0.21 18.00 14.10 76.00 3.51 4.36 KI-SLS 0.46 18.10 14.10 76.00 3.47 4.34 KI-Bleached 0.50 18.10 12.80 76.00 3.52 4.35 KII-Bleached 0.46 16.30 14.10 75.00 3.33 4.28 KII-SLS 0.41 16.10 14.10 75.00 2.95 4.01 KII-SAC 0.29 15.80 14.10 75.00 3.02 3.90 KII-Oil 0.26 16.00 14.10 75.00 2.72 3.74 KII-Bleach-Oil 0.25 15.90 14.00 75.00 2.71 3.73 O-SAC 0.49 0.00 13.00 94.00 1.75 2.69 O-SLS 0.61 0.00 13.00 94.00 2.24 3.04 O-Bleached 0.64 0.00 11.00 95.00 2.32 3.28 Cau-SAC 0.47 0.00 10.90 77.00 1.62 2.46 Cau-SLS 0.53 0.00 10.90 77.00 1.84 2.64 Cau- Bleached 0.56 0.00 10.30 77.00 2.18 3.02 KI-SAC no rinse 0.39 14.40 9.40 86.00 2.72 3.68 KI-SAC rinse 0.51 14.00 9.40 86.00 3.10 3.98 KI-SLS 0.64 14.80 9.40 86.00 3.07 4.03 KI-Bleached 0.71 14.40 9.00 87.00 3.30 4.27 Friction = frictional coefficient (•). N Curvature - (Lc/br) Stiffness in gm/mm elastic extension. Diameter in microns. LOG PCL in grams converted to log 10. Yin eta/. (13), several years ago, presented combing data suggesting an increase in combing effort with increasing fiber diameter, consistent with the sign of the Beta coefficient of our data. Nevertheless, these same authors proposed the reverse effect, and suggested that variables other than diameter (not measured) were influencing their re- sults. In this current study there are two different diameter effects, a hair type effect and a treatment effect. For the different hair types, tresses of the same weight provide an increasing number of hairs with decreasing diameter. For the treatment effects, how- ever, the number of hairs remain constant and hair fiber thickness increases. The hair type effect should provide a decrease in combing effort with increasing diameter, but the treatment effect appears to provide the opposite result. For the four different hair types, diameters varied from 71 to 86 microns, while for treatments they varied from

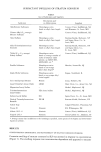
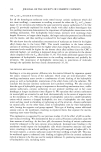
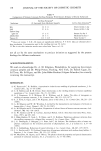
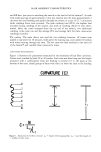
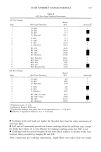
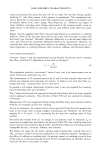
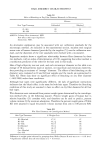
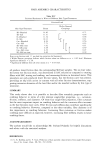
150 JOURNAL OF THE SOCIETY OF COSMETIC CHEMISTS Table ¾' Results of Regression Analysis of Hair Combing and Single-Fiber Properties Log PCL or Log ACL PCL ACL =EF, C,S,D R 2 = 0.938 P F = 0.001 R 2 = 0.947 P F = 0.001 B Coefficients:• and (P T)• log PCL log ACL Curvature + 0.80** + 0.79** Stiffness - 0.28** - 0.32** Friction + 0.16' + 0.10 NS Diameter + 0.06 NS + 0.09 NS -b •: P T = probability of significance: ** Significant beyond o• = 0.01 level. * Significant beyond o• = 0.05 level. NS Not significant. Data analyzed by Proc Stepwise and Proc Reg of SAS Institute (11). • B Coefficients = standardized partial regression coefficients. 71 to 94 microns. The treatment effect is over a greater diametral scale and appears to be dominant over the hair type effect in these experiments, but it only approaches significance for the work of combing and not for PCL. Since the major concern in cosmetics is with treatment effects, we conclude that the effect of increasing fiber diam- eter is to increase combing effort, but it is probably not a large effect. The signs of the partial regression coefficients (Table VI) suggest that increasing hair fiber curvature or fiber friction makes hair more difficult to comb. However, increasing fiber stiffness makes hair easier to comb. This observation may be explained if one considers that a primary impact on combing occurs in front of the comb as it advances through the hair. The stiffer the individual hairs the less readily they cross over and entangle along the entire tress in front of the advancing comb. Thus the fewer entangle- Table VI Multiple Regression Results Considering F, S, D and C 2 log PCL or = E F, C2, S, D log ACL For log PCL R 2 = 0.966 For log ACL R 2 = 0.974 Curvature Stiffness Friction Diameter Beta Coefficient log PCL 0.84** - 0.25'* +0.20** + 0.06 NS log ACL 0.83** - 0.29'* + 0.14'* + 0.08 NS ** Significant beyond o• = 0.01 level. NS, Not significant at o• = 0.05 level.
Purchased for the exclusive use of nofirst nolast (unknown)
From: SCC Media Library & Resource Center (library.scconline.org)