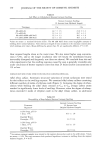
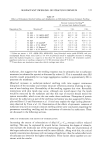
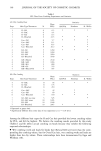
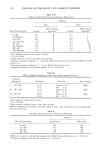
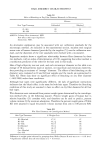
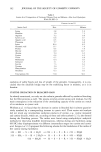
HAIR ASSEMBLY CHARACTERISTICS 155 Table XI Effect of Bleaching on Dry Fiber Diameter Measured via Microscopy Hair Type/Treatment Microns Unbleached Bleached O-SLS KI - SLS 89 83 90 83 ANOVA: Column effects (treatment): NSD. Row effects (hair type): Significant. Interactions: NSD. An alternative explanation may be associated with our calibration standards for the microscopic method. As indicated in the experimental section, stainless steel surgical suture wire of known diameter [provided by the supplier (7)] was the calibration stan- dard, and the diameters of the wire standards were checked with a micrometer. Regression analysis shows a significant relationship between fiber diameters by these two methods, with an index of determination of 0.96, suggesting that either method is a satisfactory predictor of the other for the hair used in this study. Hair of high ellipticity was not used, and each microscopic diameter in this table is an average of 50 measurements made at random, not maximum and minimum diameters, thus providing an estimate of "average" diameter. The effects of hair bleaching on dry diameter were evaluated on O and KI hair samples and the results are summarized in Table XI. These data show no significant effect of bleaching on dry fiber diameter (--60% RH) under these conditions. Although hair types were significantly different, the lack of significant interactions indicates that the bleach effect is the same for both hair types. Therefore the bleaching conditions of this study are assumed to have no effect on dry fiber diameter for all four hair types. Wet diameters were estimated from percent weight gains determined by the centrifuga- tion method (20), in the following manner. Percent weight gains of human hair vs relative humidity (21) correlate with, and therefore can be used to predict, percent volume increase (9) by moisture adsorption. Therefore the percent weight gains of Table XII were assumed to equal the percent volume increase from zero to 100 percent RH. Table XII Wet Fiber Diameters via Centrifugation Method Hair Type/Treatment % Weight Gain Calc. Diameter KI- Bleached 47.5 * 87 KI- SLS 46.2 I 86 KI- SAC 46.0 86 O-Bleached 39.6 I 95 O-SLS 38.4 94 Cau-Bleached 36.2 I 77 Cau- SLS 35.6 77 Differences in weight gains indicated by groupings from Waller Duncan K ratio test at o• = 0.05 level. * Significantly different from all other means at o• = 0.05 level.

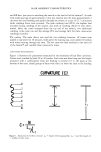
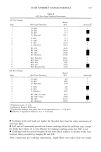
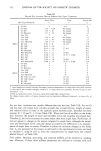
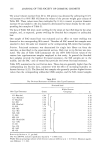
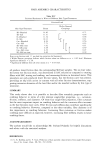
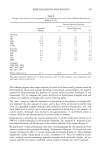
156 JOURNAL OF THE SOCIETY OF COSMETIC CHEMISTS The actual volume increase from 60 to 100 percent was obtained by subtracting 16 [% vol increase 0 to 60% RH (9)] from the values of the percent weight gain column of Table XII. These values were then multiplied by 0.44 to convert to percent diameter increase (9) and added to the dry diameters determined by linear density for the corre- sponding hair samples of Table X. The data of Table XII show more swelling for the steam set hair (KI) than for the other samples, and, as expected, greater swelling for bleached hair compared to unbleached hair. One sample of SAC-treated hair was evaluated and no effect on water swelling was detected vs the corresponding SLS control. Therefore all SAC-treated hair samples were assumed to have the same wet diameter as the corresponding SLS-treated hair samples. Friction. Frictional resistance was determined for single hair fibers cut from the swatches, as described in the experimental section. Only root to tip friction was mea- sured. The data of Table XIII summarizes the dry (60% RH) friction values of the various hair type/treatment samples employed in this study. In general the bleached hair samples provide the highest frictional resistance, the SLS samples are in the middle, and the SAC- and oil-treated hair provides the lowest frictional resistance. Table XIV summarizes the wet friction data. These data are generally higher than the corresponding dry friction data, consistent with the effect of increasing humidity on keratin friction (4,22). The bleached hair samples also generally produce higher friction values than the corresponding unbleached (SLS) samples, and the SAC-treated samples Table XlII Dry Frictional Resistance of Different Hair Types/Treatments Frictional Load Waller Duncan Hair Type/Treatment Grams Groupings KI- Bleached 6.84 Cau- Bleached 6.68 O- Bleached 6.36 KI-SLS 6.04 KII- Bleached 5.88 O- SLS 5.74 KII-SLS 4.98 Cau-SLS 3.44 KII-SAC 3.14 O-SAC 3.09 KII-Oil 2.83 KII- Bleach/Oil 2.78 Cau- SAC 2.71 O-Oil 2.65 Cau-Oil 2.42 KI-SAC 2.39 KI-Oil 2.35 0.50 0.49 0.48 0.46 0.46 0.45 0.41 0.31 0.29 0.28 0.26 O.25 O.25 0.24 0.22 0.21 0.21 Root to tip friction at 1.1 glTl load. One way ANOVA indicates significance beyond tx = 0.0001 level. Waller Duncan groupings indicate which friction values are different at tx = 0.05 level. Minimum signifi- cant difference = 1.064.
Purchased for the exclusive use of nofirst nolast (unknown)
From: SCC Media Library & Resource Center (library.scconline.org)