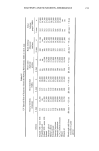
SILOXANES ON KERATINS BY FTIR 251 DRIFTS accessory, purge for 5-10 minutes, maximize signal output, and collect 300 scans for the sample. Repeat collection until CO2 and water vapor contributions are minimized. Clean the DRIFTS macro-cup and repeat preparation steps until all samples are completed. Run all samples in duplicate. Scan the IR spectra for Amide I and II band maxima. Amide I should be 1660 ___ 5 cm -1 and Amide II should be 1520 cm-1. Repeat sample if outside these limits. QUANTITATION PROCEDURE Important for quantitation was development of a linear IR response with concentra- tion. For transmission measurements, the y-scale is in absorbance units to provide a linear response with concentration. For diffuse reflectance the proper y-scale is a func- tion of reflectance. Kubelka and Munk (11) developed a general theory for diffuse re- flectance of scattering layers within powdered samples and derived the following equa- tion: fiR) = (1 - R)2/2R = k/s where R is the reflectance at infinite depth, k is the molar absorption coefficient, and s is a scattering coefficient. Software in the Nicolet FTIR system allows for easy conver- sion of the data to Kubelka-Munk units. After conversion of the spectra to Kubelka-Munk units, prepare for measurement of the band intensities of the 1260 cm -•, 1240 cm -•, and 1225 cm -• bands. Individual programs (MACROs) within the Nicolet system were developed to automatically calcu- late the band intensities with respect to a specific baseline. The baseline used for this area of the spectrum was 1359- 1178 cm- •. These programs simulate standard IR cal- culation procedures and eliminate hand calculations. Calculate the band ratios of 1260/1240, 1260/1225, and 1240/1225. If the 1240/1225 ratio is greater than 1.30, repeat the sample preparation. Calculate the mg/kg Si level of the sample using the calibration curve. RESULTS AND DISCUSSION METHOD DEVELOPMENT Sample preparation. Essentially no DRIFTS signal output results from neat hair fibers. Therefore, the non-reflective hair surface must be made reflective with the aid of a good diffuse reflector. KBr is a good diffuse reflector with no absorption bands in the infrared and was selected as the reflecting medium. However, it is necessary to produce intimate contact between the reflective and non-reflective materials for a successful DRIFTS experiment. The ideal sample preparation for surface analysis would produce a thin coating of KBr on each hair fiber. Several approaches were evaluated for mixing the hair samples with KBr. The hair fibers were cut to a length of 0.25-0.50 cm using solvent- cleaned scissors. The mixing approaches included: 1) agitation of KBr and hair in a glass vial using a wrist-action shaker, 2) grinding of the two materials in a close-toler- ance glass container, tissue grinder, and 3) grinding and mixing of materials in a Barnes Analytical WIG-L-BUG. An infrared spectrum was collected using DRIFTS after each

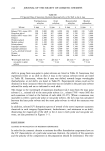
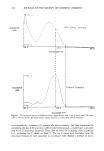
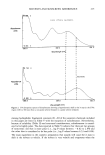
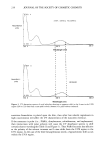
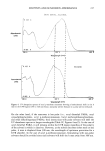
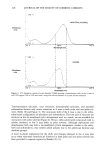
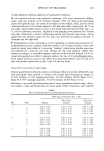
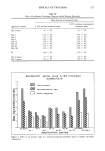
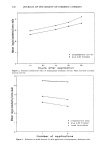
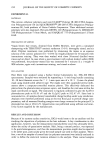
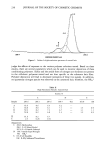
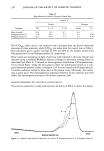
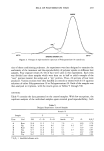
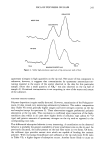
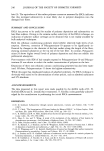
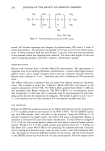
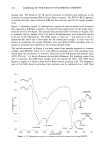
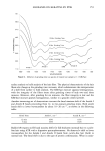
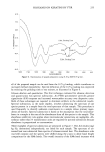
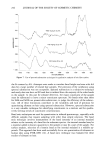
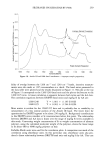
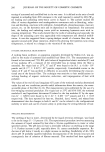
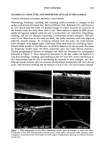
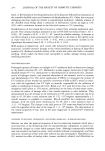
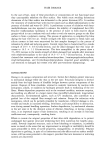
252 JOURNAL OF THE SOCIETY OF COSMETIC CHEMISTS mixing trial. The bands in the IR spectra increased in intensity and definition as the intimacy of mixing between KBr and hair fibers increased. The WIG-L-BUG appeared to provide the best contact between KBr and hair and was used for all sample prepara- tions. Figure 3 illustrates typical % transmittance spectra of silicone-treated and untreated hair prepared as KBr/hair mixtures. The general band assignments for the major inten- sities are noted in the figure. The primary hair protein bands of interest are Amide I due to carbonyl stretch, Amide II for C-N and N-H deformations, and Amide III also for C-N and N-H deformations. The SiMe band at 1260 cm -x was selected as the si- 1oxane-specific band and is detectable for the treated hair sample. A study was con- ducted to determine the proper KBr/hair ratio and WIG-L-BUG grinding time re- quired to maximize the intensity of the siloxane-specific band. The spectra presented in Figure 4 are from treated hair samples prepared at constant weight using KBr/hair ratios of 1:1 and different grinding times. The grinding times varied from two minutes to 12 minutes. Only part of the full spectra was plotted, from 1850-950 cm-x, to better illustrate the spectral differences. For grinding times of six and 12 minutes, the SiMe band merges with the Amide III band. The SiMe band begins to appear as a distinct band with a three-minute grinding time. The disappear- ance of the SiMe band as grinding time increases can be interpreted as a shift from 64.6 58.9 53.5 uJ 48.1 z • 42.7 z 37.3 31.9 26.5 Treated Hair • / / J •u Untreate N_H Slre•tch C-H Stretch Am,d e I -•-•-•J' •'% A rn•ime': alII 4300 3900 3500 3100 2700 2300 1900 1500 1100 700 WAVENUMBERS Figure 3. % Transmittance spectra of siloxane-treated and untreated hair using DRIFTS.
Purchased for the exclusive use of nofirst nolast (unknown)
From: SCC Media Library & Resource Center (library.scconline.org)