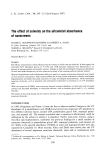
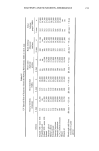
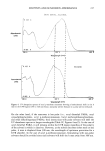
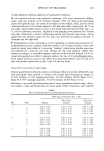
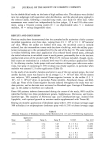
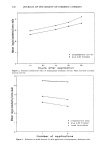
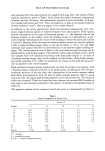
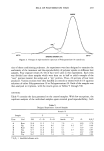
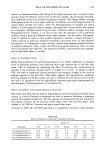
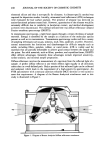
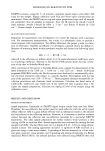
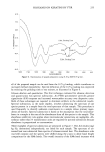
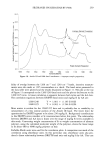
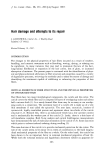
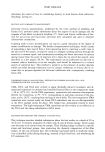
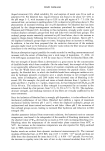
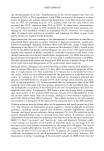
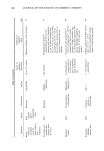
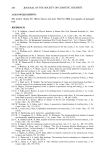
SILOXANES ON KERATINS BY FTIR 253 76.1 66.8 57.5 48.2 38.9 29.6 12 M•n. Grinding %me 6 M•n. Gnnd•ng T•me 20.3 11.0 3 Min. Gnndlng %me Amide I 2 Mm, Grinding Twn• 1850 1750 1650 1550 1450 1350 1250 1150 1050 950 WAVENUMBERS Figure 4. Influence of grinding time on spectra of treated hair sample at 1:1 KBr/hair. surface analysis to bulk analysis of the hair fiber. The physical characteristics of the hair fibers also change as the grinding time increases, which substantiates the interpretation of a shift from surface to bulk analysis. The KBr/hair mixture appears heterogeneous, with the integrity of the fibers intact after grinding times of only two and three minutes. However, after grinding for six minutes, the fiber integrity is lost and the KBr/hair mixture appears homogeneous, similar to a grayish colored powder. Another interesting set of observations concerns the band maxima shift of the Amide ! and Amide II bands proceeding from 12- to two-minute grinding times. Both amide bands shift to lower wavenumbers by about 10-20 cm-•, as shown in the following table: Grind Time Amide I, cm-• Amide II, cm-• 12 min 1670 1533 3 min 1654 1524 Baddiel (8) reports on IR band maxima shifts for full-thickness (normal) hair vs cuticle- free hair using ATR with a dispersive spectrophotometer. He observed a shift to lower wavenumbers for the Amide ! and Amide I! bands from cuticle-free hair (bulk) to normal hair. The band shift is due to the type of protein conformation. What is consis-

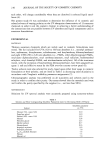
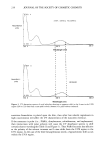
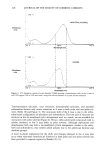
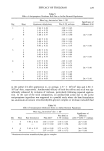
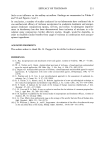
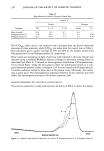
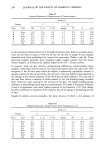
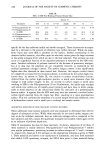
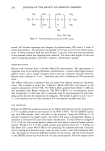
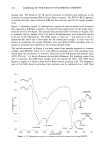
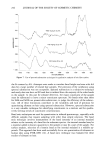
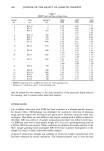
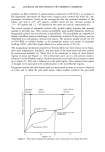
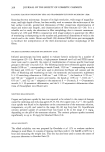
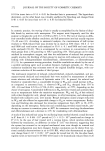
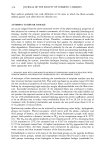
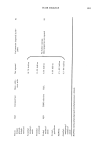
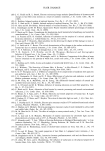
254 JOURNAL OF THE SOCIETY OF COSMETIC CHEMISTS tent between the Baddiel and DRIFTS results is that as the SiMe band intensity in- creases, indicating more fiber surface response, the Amide I and Amide II bands shift to lower wavenumbers, indicating a cuticle-rich phase. Again, these observations are con- sistent with surface-vs-bulk analysis of the fibers. It also demonstrates the importance of maintaining constant, repeatable sample preparation techniques to generate consistent spectra and data. Additional experiments were conducted to define the optimum KBr/hair ratio. The spectral definition of the bands (sharpness) increased as the KBr/hair ratio was varied from 1 to 4. Above 4, the total signal output decreased due to dilution of the hair sample with KBr. Therefore, a KBR/hair ratio of 4 was used. The quantity of sample (WIG-L-BUG vial loading) also influences spectral definition, as illustrated in Figure 5. Both spectra were collected at a 4:1 KBr/hair ratio and two-minute grinding time, but spectrum A was collected with a 0.50 g vial loading and spectrum B with a 0.25 g loading. The level of agitation in the vial is greater for the 0.25 g loading, as shown by the decreased intensity of the SiMe band relative to the Amide III band, indicating greater bulk analysis of the fiber rather than surface anal- ysis. The 0.25 g loading was selected even though the SiMe band intensity appears greater with the 0.5 g loading for two-minute grinding times. The reasoning for selec- tion of the 0.25 g of loading concerns the heterogeneous character of the KBr/hair mixture. The 'DRIFTS sample cup capacity for KBr/hair mixtures is 0.2-0.3 g. Thus, 75.5 69.0 62.5 uJ o 56.0 z 49.5 43.0 36.5 30.0 SpectrumHa••GAKBr/0.10 0.40 G ide III 0.20 G KBr/0.05 G Hair Spectrum B i 1850 1750 1650 1550 1450 1350 1250 1150 1050 WAVENUMBERS Figure 5. Influence of sample size in grinding vial on spectra of treated hair. i 950
Purchased for the exclusive use of nofirst nolast (unknown)
From: SCC Media Library & Resource Center (library.scconline.org)