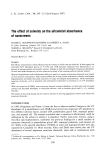
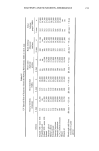
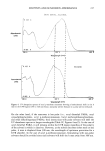
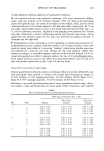
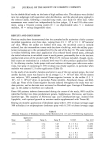
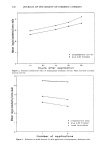
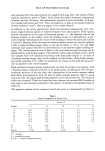
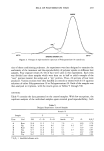
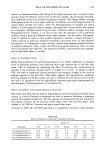
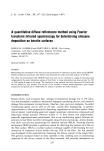
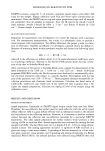
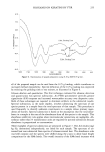
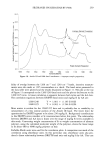
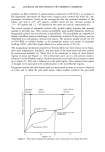
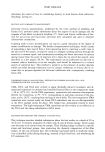
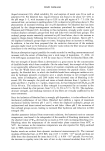
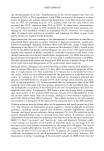
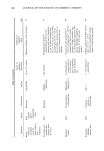
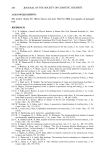
SILOXANES ON KERATINS BY FTIR 257 The spectra presented in Figure 8 show untreated and two samples of siloxane-treated hair. The mg/kg Si determined by AA for the two treated samples are 550 and 1190 for spectra B and C, respectively. The y-scale was plotted in Kubelka-Munk units of ra- diant intensity. Three hair-protein bands were selected to ratio against the SiMe band at 1260 cm -•. The three bands and wavenumbers are identified in Figure 8 at 1525, 1240, and 1225 cm-•. The 1525 cm-• band is the Amide II band and the 1240 and 1225 cm -• bands are from the broad Amide III area. The three band ratios of 1260/1525, 1260/1240, and 1260/1225 were calculated and tabulated for a variety of treated and untreated hair samples. No correlation between 1260/1525 ratios and AA data was observed. The greater intensity of the 1525 cm-1 band relative to the SiMe band is probably the reason for the lack of correlation. It is known that the linear range for quantitation by DRIFTS is dependent upon the intensity of the specific band. How- ever, a correlation is evident between 'the 1260 ratios with the Amide III bands and the AA data, where the bands are of similar intensity. Data validation criteria. Detection and quantitation of siloxane on hair using DRIFTS is basically a surface analysis technique. Because hair is non-reflective, the succes• of the method is almost totally dependent upon sample preparation and generation of a KBr reflective surface. The data must be scrutinized to insure it is obtained from the surface of the sample. To that end, criteria have been developed to distinguish between surface and bulk analysis. These criteria are: 49.0 42.7 35.9 29.1 22.3 15.5 8.7 1.9 r 1850 Untreated Hair 550 mg/kg Si by AA 1190 mg/kg Si by AA 1525 cm - • 1260 cm- • 1240 c 1225 cm - • I I I I I I • 1750 1650 1550 1450 1350 1250 1150 WAVENUMBERS Figure 8. Quantitation of siloxane using band ratio technique. i 1050 i 950

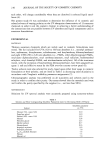
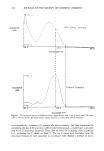
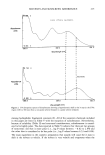
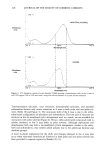
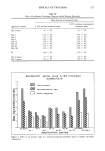
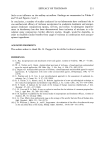
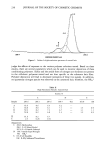
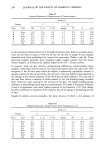
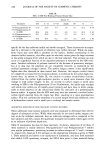
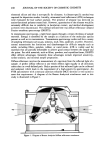
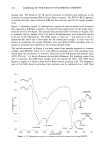
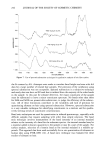
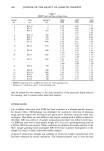
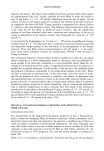
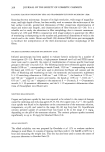
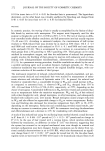
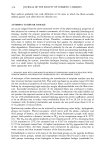
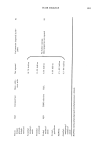
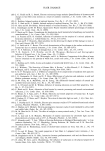
258 JOURNAL OF THE SOCIETY OF COSMETIC CHEMISTS 1) Amide I band at 1660 cm-• and Amide II band at 1525 cm-• 2) Band ratio intensities of 1240/1225 • 1.3 The importance of the Amide I and II band maxima positions is described earlier in the Method Development section. Data points generated with shifted Amide band posi- tions should be deleted from the study and the samples prepared again. The second criterion concerns the Amide III band intensities which are being used as internal stan- dards. It appears that if sufficient agitation does not occur during grinding, the 1260 cm-• band intensity is too large relative to the protein contribution. The indicator for acceptable sample preparation is the 1240/1225 band ratio, where the value must be •1.3. Examples of Amide I and II band shifts and improper 1240/1225 ratio are illustrated in Figures 9 and 10, respectively. CORRELATION OF DRIFTS AND AA DATA The DRIFTS/AA data is summarized in Table I. The siloxane polymer used to treat the hair samples was based upon a 100 DP (degree of polymerization) 2 mole % amine- functional polymer or derivative. The mg/kg Si values determined from AA analysis cover the range of 180 to 1840. The two untreated hair samples exhibit non-zero back- ground IR ratios due to the breadth of the Amide III band, as illustrated in Figure 8. The Amide III band maximum is close to 1240 wavenumbers. But, due to the possi- 51.0 43.8 36.5 29.2 .•21.9 14.6 7.3 1680 cm- • • 1540 cm- • ____ 1 • i I I 1 I I i I 1 50 1750 1650 1550 1450 1350 1250 1150 1050 950 WAVENUMBERS Figure 9. Amide I and Amide II band maxima shifts--bulk vs surface analysis.
Purchased for the exclusive use of nofirst nolast (unknown)
From: SCC Media Library & Resource Center (library.scconline.org)