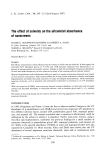
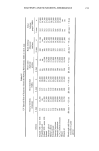
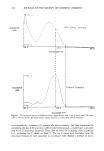
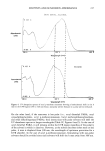
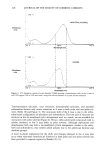
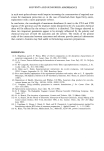
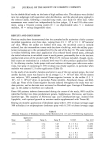
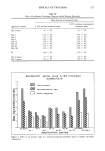
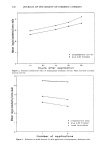
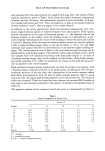
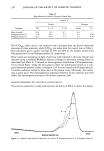
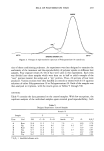
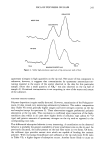
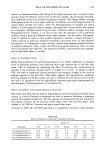
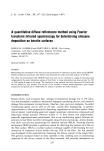
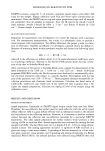
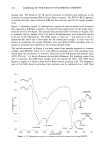
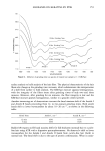
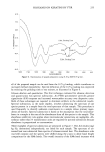
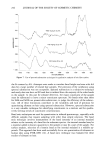
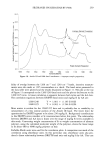
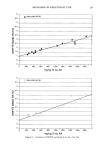
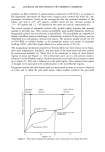
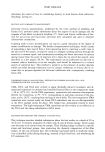
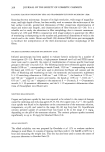
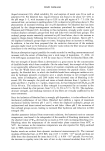
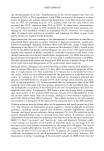
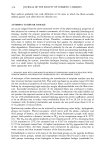
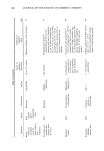
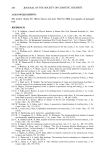
SILOXANES ON KERATINS BY FTIR 259 51.0 44.0 37.0 30.0 23.0 16.0 9.0 2.0 n Proper Sample Preparation r i i i i i i 1 i i 1850 1750 1650 1550 1450 1350 1250 1150 1050 950 WAVENUMBERS Figure 10. Amide III and SiMe band interference--improper sample preparation. bility of overlap between the 1260 cm -t and 1240 cm -t bands, intensity measure- ments were also made at 1225 wavenumbers as a check. The band ratios presented in the data table were plotted and the results illustrated in Figure 11. The plot at the top of Figure 11 corresponds to the 1260/1240 band ratio and the plot at the bottom to the 1260/1225 ratio. A linear correlation is apparent between both ratios and the AA data. The correlation equations between DRIFTS band ratios and mg/kg Si by AA are: 1260/1240 1260/1225 Y = 1.001 + (1.195 E-03)X Y = 0.963 + (1.564 E-03)X. More scatter is evident for the 1260/1225 data and is probably due to variability in measurement of a less intense portion of the Amide III band. The lower limit for quantitation by DRIFTS appears to be about 250 mg/kg Si. Background contributions to the DRIFTS ratios interfere at Si concentrations below this point. The relationship between DRIFTS and AA data is linear over the range of mg/kg Si levels available in this study. Converting weight concentration of Si to weight concentration of siloxane polymer, using the calculated molecular weight of the polymer, shows the linear range to be about 680 to 4900 mg/kg polymer on hair. Kubelka-Munk units were used for the correlation plots. A comparison was made of the correlation using absorbance units. In this particular case, absorbance units also pro- duced a linear relationship between DRIFTS band ratio and mg/kg Si by AA. This case

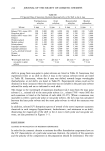
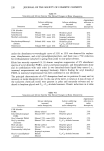
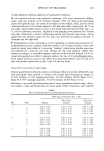
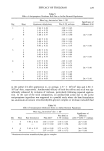
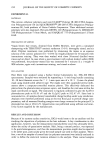
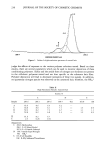
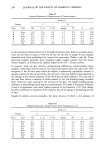
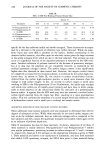
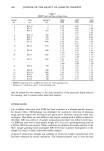
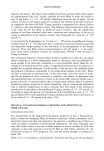
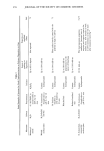
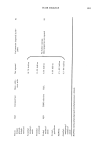
260 JOURNAL OF THE SOCIETY OF COSMETIC CHEMISTS Table I DRIFTS and AA Data on Hair Fibers Sample Hair mg/kg Si 1260 • 1260 • 1240 no. ref. AA 1240 1225 1225 1 K14.17 0 0.58 0.68 1.17 2 K1.31 0 0.74 0.80 1.08 3 K14.2 402 1.38 1.60 1.16 1.22 2.37 1.94 4 K14.15 580 1.78 1.72 0.97 5 K95.1 350 1.48 1.46 0.99 6 K95.7 270 1.36 1.61 1.19 7 K1.23 1840 2.46 3.61 1.46 3.36 4.12 1.23 8 K6.25 1555 2.49 3.06 1.23 2.76 3.12 1.13 9 K6.26 1190 3.13 4.40 1.41 2.502 2.722 1.092 10 K6.27 1040 1.972 2.702 1.372 2.212 2.452 1.112 11 K14.7 1460 2.93 4.22 1.44 3.97 5.59 1.41 2.982 3.802 1.282 12 K95.2 430 1.44 1.63 1.14 1.58 1.76 1.11 13 K95.8 260 1.25 1.52 1.22 14 K14.14 1060 1.94 2.70 1.39 15 K95.3 180 0.91 1.13 1.24 16 K14.8 550 1.67 1.54 0.92 17 K14.4 180 0.73 0.73 0.99 DRIFTS conditions of 0.2 g KBr/0.05 g hair for 1-min grinding time. Exception to •conditions, used 1.5-min grinding time. may be unique for two reasons: 1) the close proximity of the particular bands selected for ratioing, and 2) surface rather than bulk analysis. CONCLUSIONS Use of diffuse reflectance with FTIR has been evaluated as a siloxane-specific detector for keratin fibers. Methodology was developed for qualitative detection of siloxanes using spectral subtraction techniques and quantitative detection using the band ratio technique. Hair fibers are non-reflective and require mixing with a reflective material therefore, KBr was selected. A sample preparation procedure was defined involving a 4:1 KBr/hair ratio with a total sample weight of 0.25 g and a grinding/mixing time in a WIG-L-BUG for one minute. These conditions are optimum for surface analysis of the fiber. Longer grinding times and higher KBr levels lead to greater homogeneity of the sample but result in bulk rather than surface analysis. A series of treated hair samples was available on which the weight concentration of Si had been measured by atomic absorption. The siloxane polymer used to treat the hair
Purchased for the exclusive use of nofirst nolast (unknown)
From: SCC Media Library & Resource Center (library.scconline.org)