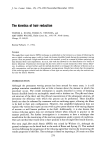
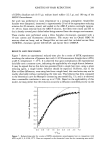
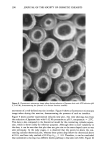
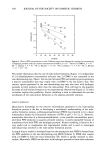
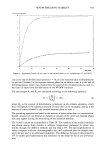
288 JOURNAL OF THE SOCIETY OF COSMETIC CHEMISTS 0.7 0.2- 0.1 - 0.0 0.1 0.2 0.3 0.4 0.5 0.6 0.7 0.8 0.9 .0 Fraction of Reaction Figure 6. First derivative of the reduced-time plot for the Avrami-Erofeev n = 2 model, expressed as a function of the fraction of reaction. reaction rate. The intermittent stress relaxation method can be assumed to reduce the extent of the above effect as the fiber is not under strain at all times. Additionally, it also reduces the possibility of mechanically induced effects. The test system consists of a double-walled cylindrical cell containing an inlet, an outlet, and a hook fitted to the base for engaging the fiber. The inner cell contains the test solution, while the external cell is attached to a circulating water bath to maintain constant temperature. The hair fibers are trimmed to 2 inches in length and are attached at each end to plastic tabs. One end of the fiber is then attached to the hook in the cylinder, while the other is clamped to the load cell. The fiber is first equilibrated by carrying out a series of strain cycles in water for a five-minute period. FLUORESCENCE MICROSCOPY The nature of the reaction is also monitored using fluorescence microscopy. Wickett obtained visual support for his kinetic results by staining thick sections of the reduced hair fibers with methylene blue. In this method, the extent of penetration of the dye is controlled by the porosity of the reduced fibers, the guiding assumption being that the porosity would increase as a result of the reduction of the hair fibers. Toy'oka and Kazuhiro (10) have described a method for selectively tagging the reduced sites them- selves, using the fluorochrome ABD-F [4-(aminosulfonyl)-7-fluoro-2, 1,3,- benzoxadiazole], and Evans (11) has used this material to investigate the penetration of reducing agents into wool. The method used in this investigation is a modification of the method described by Evans. The ABD-F fluorochrome was custom synthesized by MediChem Research, Inc., Lem- ont, Illinois. The test solution was prepared by dissolving 12.4 g of boric acid in 80 ml ofdeionized water. The pH was adjusted to 8 with 2 N NaOH, followed by the addition

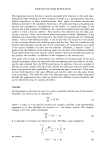
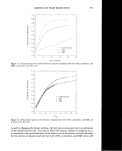
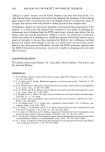
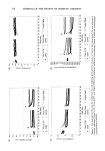
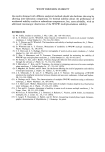
KINETICS OF HAIR REDUCTION 289 of EDTA disodium salt (0.55 g), sodium laurel sulfate (12.5 g), and 100 mg of the ABD-F fluorochrome. All work was performed at room temperature in a nitrogen atmosphere. Small-fiber bundles were dampened, immersed in approximately 20 ml of the appropriate reducing solution for 20 minutes, rinsed, and soaked in the ABD-F solution overnight (approx. 15-18 hr). Upon removal from the ABD-F solution, the fibers were rinsed and left to dry in loosely covered petri dishes before being removed from the nitrogen environment. These studies were performed using a Zeiss Axioplan microscope, equipped with a 35-mm camera and fluorescence attachments. The source was an Osram HBO 50 mercury short-arc lamp, and an Omega filter set was used that included exciter filter 360WB50, chromatic splitter 400 DCLP, and barrier filter 430EFLP. RESULTS AND DISCUSSION Figure 7 shows an experimental reduced-time plot for a series of SFTK experiments involving the reduction of Japanese hair with 0.42 M ammonium thioglycolate (ATG) at pH 9, temperature = 25øC. It is observed that upon normalization the experimental data falls onto a common curve, indicating the applicability of a single kinetic behavior. It may be argued that as this data was generated from a single hair type, using a given reducing agent, a single kinetic behavior should be expected. However, due to the fiber-to-fiber differences, even using hair from a single head, this conclusion may not be readily observable without normalizing the time axis. This behavior has been compared to the theoretical curve for Mampel's contracting area model (Eq. 15), and it is observed that a reasonable correlation is seen up to ot=70%. Based on the applicability of this model, we may predict that the reduction occurs by a diffusion-controlled process via the 0.9 ' ' •.//'• •' ' 0.8 0.7 0.6 0.5 0.4 0.3 0.2 •,,•, I 0.0 , .... • .... I .... • .... • .... • .... • .... 0.0 0.5 1.0 1.5 2.0 2.5 3.0 .3.5 4.0 t/to.5 Figure 7. Reduced-time plot for a series of SFTK experiments using Japanese hair in conjunction with ATG at pH 9, 0.42 M, 25øC. Data are compared to the theoretical curve for the contracting area model.
Purchased for the exclusive use of nofirst nolast (unknown)
From: SCC Media Library & Resource Center (library.scconline.org)