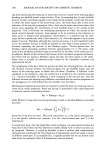
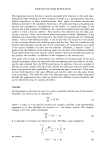
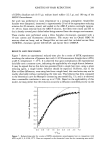
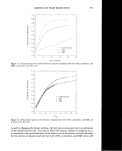
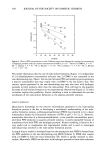
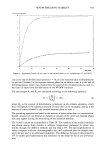
284 JOURNAL OF THE SOCIETY OF COSMETIC CHEMISTS 1.0 0.9 0.8 0.7 0.6 0.5 0.4 0.3 0.2 0.1 0.0 Moving Boundary _ First order -- 0.0 0.5 1.0 1.5 2.0 2.5 3.0 3.5 4.0 t/to.s Figure 1. Theoretical reduced-time plots for the first order model and the moving boundary expression. I I I I 0.7 • 0.6 % ..-.. % o ..o 0..5 - • 0.4- • 0..• 0.2 - 0.( 0.1 0.2 0.3 0.4 0.5 0.6 0.7 0.8 0.9 .0 Fraction of Reaction Figure 2. First derivatives of the reduce-time plots for the first order and moving bounda• models, expressed as a function of the fraction of reaction. One might expect that both reaction- and diffusion-controlled mechanisms would give rise to a deceleratory process. For diffusion-controlled processes, it is imagined that it will become more difficult for the reducing agent to advance further into the hair fibers. This results from a combination of the distance the molecules have to travel and the decreasing surface area of the reaction interface due to the cylindrical geometry. There- fore, the maximum rate would probably be expected to be in the initial stages of the

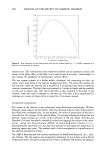
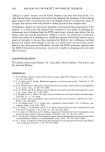
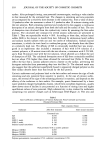
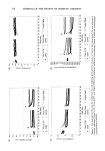
KINETICS OF HAIR REDUCTION 285 reaction. Meanwhile, for reaction-controlled processes, the maximum rate would also be expected to be in the early stages, as this represents the point where each reactant has its highest concentration. The first order model is a deceleratory mechanism, however, as seen from Figure 2, by its very definition, the decrease in rate is linear with respect to the fraction or reaction. Wickett's moving boundary model, however, represents a sigmoidal type behavior, as it has a maximum rate at •30% of the way through the reaction. This suggests the presence of an induction period during which the rate gradually increases to a given point, followed by a drop off, presumably due to one of the reasons previously outlined. One of the heterogeneous kinetic models listed in Table I that would also be expected to be relevant in hair/reducing agent interactions is Mampel's contracting area model (see ref. 7), which describes the two-dimensional propagation of an interface into a cylinder. Considering the integral form: 1 - (1 - (•)v2 = kt (15) and carrying out the normalization process gives: 1 - (1 - (•)•/2 = 0.293- t (16) t0.5 The theoretical reduced-time plot for this model is shown in Figure 3 along with that for the first order expression. It can be seen that, although one expression describes a diffusion-controlled process while the other represents a reaction-controlled process, these two models give rise to theoretical curves that are in close proximity. However, the derivatives shown in Figure 4 indicate that the contracting area models shows a more reasonable deceleratory behavior. 0.9 - - 0.8 - .o• 0.7 F - 4--) • 0.6 - ß • o.$ - .•o 0.4 • 0.3 0.2 // Contracting area 0 1 // First order ß // 0.0 / I I I I I I I 0.0 0.5 1.0 1.5 2.0 2.5 3.0 3.5 4.0 t/t0. 5 Figure 3. Theoretical reduced-time plots for the first order model and the contracting area expression.
Purchased for the exclusive use of nofirst nolast (unknown)
From: SCC Media Library & Resource Center (library.scconline.org)