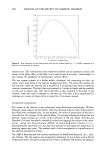
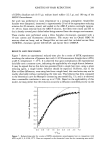
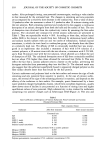
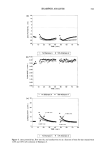
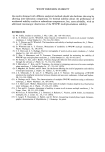
342 JOURNAL OF THE SOCIETY OF COSMETIC CHEMISTS DIHYDRALAZINE ANALYSIS From its physicochemical characteristics, dihydralazine has several interesting properties that allow its analysis. First, the benzene ring, combined with the two hydrazine functions, allows a quantification by UV spectrophotometry at 309.5 nm. Second, due to its two hydrazine functions, dihydralazine can react with ninhydrine to yield a orange-yellowish colored compound that can be detected by visible spectrophotometry at 488 nm. This will permit the analysis of dihydralazine in this external aqueous phase by direct UV spectrophotometry, visible spectrophotometry after derivatization, or RP-HPLC with UV detection. The experimental conditions of chromatographic analysis were previously studied (15). These methods were employed after a validation process. Specificity was examined for each technique from a tracerless multiple emulsion. Data on limit of detection, accu- racy, and precision (repeatability and reproducibility) are summarized in Table II. The marker recovery was determined by spiking the external aqueous phase with a known amount of dihydralazine. The recovery was 98% with the UV spectrophotometric method, 102% with the visible spectrophotometric method, and 99% with the chro- matographic method. The comparison of the three methods was based on several criteria: the method com- plexity, the overall processing time, the specificity, and the limit of detection. The chromatographic technique offered the best performances, though the others were suit- able for this purpose. APPEARANCE KINETIC OF THE TRACER IN THE EXTERNAL PHASE Two batches of the same emulsion were stored for one month at 40øC and three months at ambient temperature, 25øC. Each batch was then analyzed in triplicate by the three methods. All kinetic curves exhibited the same profile (Figure 1). The amount of tracer in the external aqueous phase showed a rapid increase followed by a plateau. Consequently, we used an exponential equation to model the dihydralazine release as a function of time. An exponential model conveniently expresses the initial rapid increase and the final ceiling of the release process. The equation in use, which corresponds to a first order kinetic, is: (Pt - Po) = A (1 - e -kt) (2) where (Pt - Po) is the difference between Pt, the percent of dihydralazine liberated in the external aqueous phase at time t, and Po, the percent of non-entrapped dihydrala- Table II Parameters of Validation UV Visible Validation parameter spectrometry spectrometry HPLC Limit of detection (g/l) 6.10 - 3 4.10 - 3 7.10 - 5 Reproducibility (CV%) 0.77 0.82 0.84 Repeatability (CV%) 0.92 1.0 ! 0.95 Accuracy (%) 0.60 0.26 0. ! 3

W/O/W EMULSION STABILITY 343 tracer m external phase 8 / / / / / / / / 5 0 i i 0 10 20 30 i i 40 50 60 time (clays) Figure 1. Appearance kinetic of the tracer in the external phase at two temperatures (25 and 40øC). zine at the end of the fabrication process (t = 0) A is the maximal value ofdihydralazine (in percent) liberated in the aqueous external phase for an infinite time k is the rate of the phenomenon, which thus characterizes the speed of the instability process and t is the time (in days) from the fabrication of the W/O/W emulsion. The percentages Pt and Po are calculated according to the following equation: where Qw is the amount of dihydralazine introduced in the primary emulsion, which thus corresponds to the maximum amount of tracer that can be entrapped, and Qt is the amount of tracer released in the external aqueous phase at time t. The preceding equations are based on the amount of tracer rather than its concentration. Indeed, amounts do not depend on changes in volumes of the inner and external phases that may appear during the monitoring of the emulsion stability. The A and k values are summarized in Table III. The stability of the studied emulsion was shown during three months at ambient temperature: parameter A values were similar through the different methods and less than 2.5%. The spectrophotometric A values compared with the chromatographic one, and confirmed that the sample treat- ment did not lead to an additional breakdown. The difference between k determined by UV or visible spectrophotometry was attributed to the delay for the in situ derivatiza- tion.
Purchased for the exclusive use of nofirst nolast (unknown)
From: SCC Media Library & Resource Center (library.scconline.org)