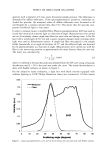
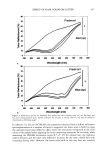
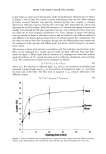
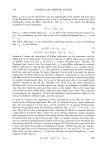
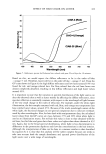
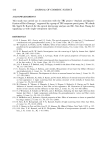
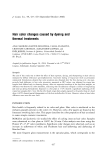
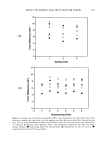
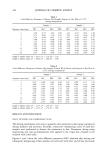
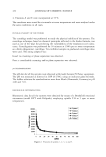
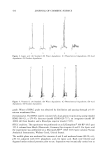
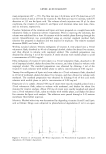
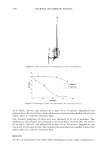
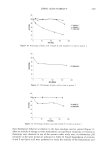
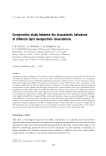
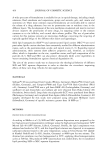
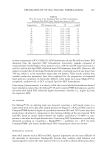
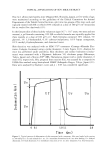
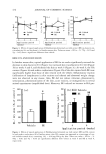
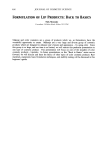
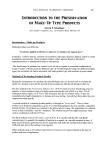
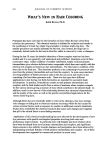
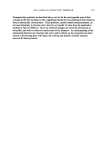
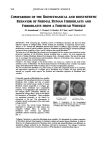
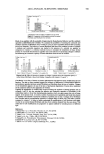
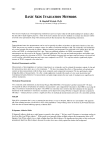
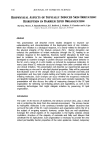
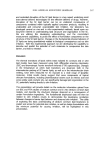
458 JOURNAL OF COSMETIC SCIENCE Figure 8. Lipoic acid: Typical chromatogram of the o/w formulations. 120 • 100 '• 80-i• _ 04- r 0 50 1 O0 150 200 time (days) Figure 9. Percentage of lipoic acid and vitamin A vs time in system 2. ml of H202, 100 vol., and refluxed for at least 10 or 30 minutes. Degradation was monitored as a function of time. Each solution was neutralized and suitably diluted with mobile phase in a 100-ml volumetric flask. One hundred milligrams of lipoic acid were dissolved in 25 ml of methanol. Two milliliters of this solution were dissolved in 10 ml of water, 10 ml of HC1 IN, and 10 ml of H202, 100 vol., and refluxed for at least 10 or 30 minutes. Degradation was monitored as a function of time. Each solution was neutralized and suitably diluted with mobile phase in a 100-ml volumetric flask. RESULTS All the o/w formulations were stable under centrifugation, with a slight modification in

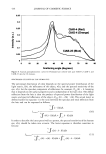
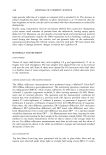
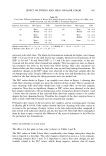
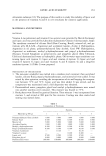
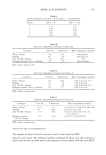
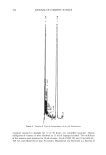
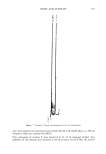
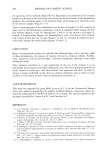
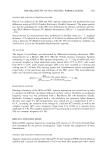
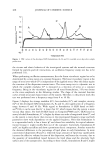
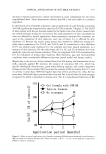
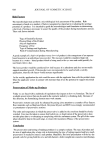
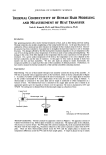
LIPOIC ACID STABILITY 459 120 100 80 •= 60 4O 0 I ?--Vitamin I?_Li_p•ø•i• acid• 50 1 O0 time (days) 150 200 Figure 10. Percentage of lipoic acid, vitamin A, and vitamin E vs time in system 4. 120 1 oo 80 õ 6o 4O [-*-- Lipoic acid I 0 50 1 O0 150 200 time (days) Figure I I. Percentage of lipoic acid vs time in system 1. 120 100 80 60 40 ipoic acid 0 50 1 O0 150 200 time (days) Figure 12. Percentage of lipoic acid and vitamin E vs time in system 3. their rheological behavior in relation to the base emulsion used as control (Figure 2). After six months of storage at room temperature, no significant variations in viscosity or thixotropy were observed in any of the systems under study since its elaboration. pH variations in the same period are indicated in Table II. Forced degradation of vitamins A and E and lipoic acid were performed to study the stability of the formulations and
Purchased for the exclusive use of nofirst nolast (unknown)
From: SCC Media Library & Resource Center (library.scconline.org)