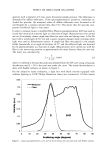
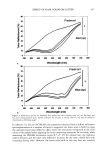
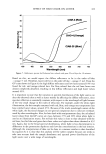
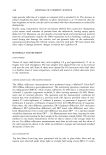
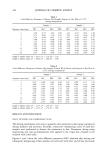
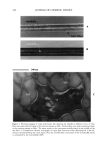
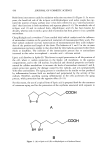
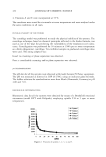
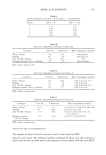
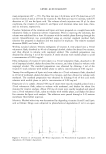
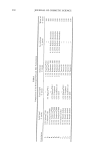
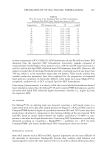
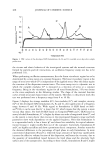
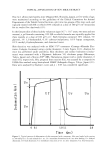
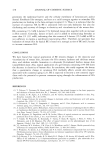
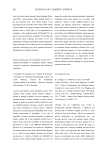
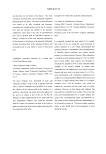
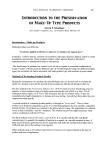
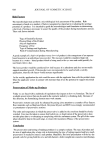
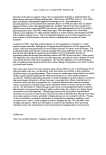
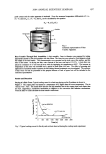
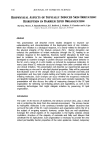
VISCOELASTICITY OF SLN AND NLC FORMULATIONS 467 Table II PCS, PI, and ( of the Developed SLN and NLC Formulations Measured One Week After Production, Stored at 20øC Formulation PCS diameter (nm) PI ((mV) A 178 + 4 0.16 + 0.04 -15 A• 192 + l 0.14 + 0.05 -19 B 209 + 3 0.25 + 0.07 -23 B• 220 + 1 0.22 + 0.08 -25 B 2 233 + 1 0.23 + 0.09 -26 B 3 231 + 0 0.19 + 0.10 -24 B 4 243 +_ 4 0.18 + 0.11 -28 C 397 -+ 3 0.56 + 0.13 -6 C• 259 _+ 2 0.35 + 0.14 -10 C 2 267 + 3 0.36 + 0.15 -11 C• 268 _+ 1 0.33 _+ 0.16 -9 C4 254 _+ 1 0.34 + 0.17 -12 at room temperature (20øC) (Table II). SLN formulations (A and B) exhibited lower PCS diameters than the respective NLC formulations. Conversely, samples composed of stearyl alcohol revealed higher mean particle sizes (250 nm) and PI values between 0.3 and 0.6, and for this lipid NLC exhibited lower PCS diameters than SLN. However, LD analysis revealed that all developed formulations had a maximum particle size lower than 700 nm, which is in the nanometer range (data not shown). These results confirm that suitable production parameters have been employed for the preparation of nanosized lipid particles composed of chemically different solid lipids and using Miglyol©812, tocopherol, sunflower oil, or LCT as liquid lipid for NLC formulations. Concerning ( measurements, it is clearly visible that stearyl alcohol formulations showed lower absolute ( values than the Softisan©138 and Compritol©888 formulations, and for all tested solid lipids NLC exhibited higher electrostatic stability (i.e., higher [([) than the respective SLN. DSC ANALYSIS For Softisan©138, no melting peak was detected, revealing a still liquid status or a supercooled melt seven days after sample production (Figure 1). SLN and NLC based on Compritol©888 showed a degree of crystallinity between 60% and 70% (seven days after production), calculated in comparison to the melting enthalpy of the raw material. SLN and NLC based on stearyl alcohol showed the highest crystallinity (75-80%) in com- parison to the other developed formulations. Concerning NLC formulations, crystallinity decreased according to: tocopherol Miglyol©812 sunflower oil LCT, for both Compritol©888 - and stearyl alcohol-based NLC formulations (data not shown). RHEOLOGICAL ANALYSIS Semi-solid systems such as SLN and NLC aqueous dispersions are the most difficult of the materials to characterize rheologically because they combine solid behavior and liquid properties within the same material (10-12). In order to obtain information about

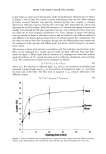
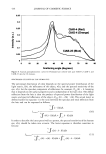
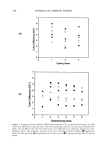
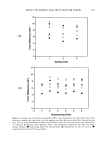
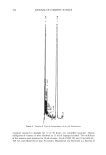
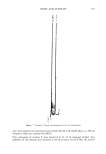
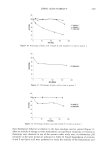
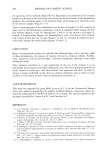
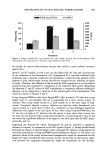
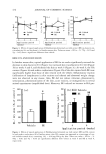
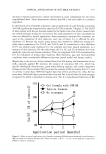
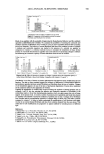
468 JOURNAL OF COSMETIC SCIENCE 1,2 -0,2 Temperature (øC) Figure 1. DSC curves of the developed SLN formulations (A, B, and C) recorded seven days after sample production. the viscous and elastic behavior of the investigated systems and the network structure formed by particle-particle interactions, an oscillation frequency sweep test has to be performed (13). When performing oscillation measurements, first the linear viscoelastic region has to be determined by a stress sweep at a constant frequency. The linear viscoelastic region is the range of stress over which G* is independent of the applied stress. Over this linear region the structure of the dispersion remains intact. The stress sweep test is a dynamic test in which the complex modulus G* is measured as a function of stress at a constant frequency. Being in the viscoelastic region for all tested formulations, 5 Pa was chosen as the stress amplitude in the following studies. The shape of the material function curves reveals structural characteristics of the system. Therefore, in the present work this test was performed over a frequency range from 0 to 10 Hz. Figure 2 displays the storage modulus (G'), loss modulus (G"), and complex viscosity (Xl*) of the developed SLN formulations (A, B, and C), after application of a frequency range between 0 and 10 Hz. With regard to formulation A (SLN based on Softi- san©138), it can be seen that G' is lower that G", which means that the system is more viscous than elastic. For both B (SLN based on Compritol©888) and C (SLN based on stearyl alcohol) formulations, G' is higher by about one order of magnitude than G", and so the system is more elastic than viscous in the investigated frequency range and both parameters show weak dependence on the applied frequency. Note that formulation A is a supercooled melt it has a lower Xl* and shows less suitability for topical adminis- tration because it might readily flow out of the container. Conversely, formulations B and C are highly crystalline and show a prominent elastic component. Another reason for the obtained differences is the percentage of lipid phase in each formulation. In more concentrated dispersions (B and C), relatively large amounts of lipid may significantly increase the effective volume fraction of the dispersion, and hence the viscosity, due to the quantity of immobilized liquid between the lipid phase and the relatively high surface area of the nanoparticles. According to these results, formulations B and C might
Purchased for the exclusive use of nofirst nolast (unknown)
From: SCC Media Library & Resource Center (library.scconline.org)