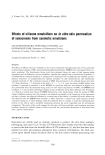
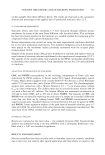
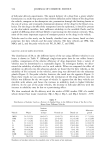
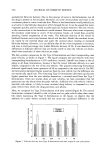
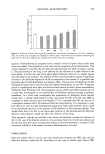
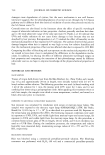
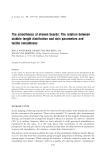
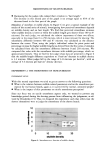
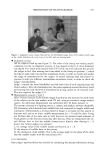
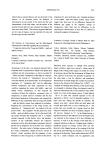
SMOOTHNESS OF SHAVEN BEARDS 547 Figure 7. Judgment session lineup. Depicted are the blindfolded judge, three of the subjects (with rings on the cheeks indicating the correct spot to be felt), and one training head. ß Judgment session: All six subjects lined up (see Figure 7). The order of the lineup was varied pseudo- randomly over the six judgment sessions. A ring-shaped sticker (1.8 cm in diameter) was placed over cheek spots marked with UV-visible ink and indicated the spot for the judges to feel. One training head was added in the lineup on position 1, which had shaven sides with two extreme smoothness levels, in order to stretch and anchor the range of smoothnesses for the judges. A second training head was placed on position 8 with two different intermediate smoothness levels, in order to check the judges' reproducibility. Judge 1 entered the room blindfolded and felt both sides of each training head and of each subject. After this familiarization, the judge separately assessed for every cheek and training head side the level of smoothness by giving a point on a 0-10 point scale. This was repeated for judges 2-9. ß Measurements sessions 2 and 3: After 24 hours (session 2) the stubble length distribution was measured on each cheek of the subjects on the spot marked with UV ink, using an automatic image analysis system. An additional measurement was performed after 48 hours (session 3). The system consisted of a lighting source, a camera, and analysis software (AnalySIS, SIS, Germany), which detected each stubble hair and computed its length, width, and orientation. Unfortunately, a 24-hour beard or longer is necessary for this system to function well, and so no direct stubble measurement at t = 0 could be done. Using our 48-hour data of the same spot as well, however, we assumed equal amounts of beard growth on the first and second day after shaving. Thus we extrapolated the 24- and 48-hour data to find the stubble characteristics directly after shaving (t -- 0 hours). For further analysis we retained: L, the average value of the stubble length distribution, at t = 0 N, the density of stubble hairs in the picture O, the orientation of the stubble. This is the average angle (in the plane of the skin) that the stubble makes with the vertical axis (0ø). DATA PROCESSING Each judge's reproducibility was checked by calculating the standard deviations during

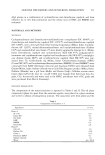
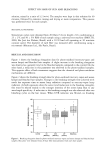
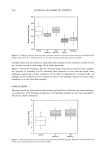
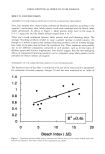
548 JOURNAL OF COSMETIC SCIENCE the sessions in the judgments for each of the two sides of the second training head. It appeared ineffective to try to reduce these values by a judge and session-dependent transformation of each judge's judgment scale. Instead, we applied a linear judge-depen- dent transformation on all raw judgment data, such that each judge's average judgments of both sides of the first training head were equal to the overall averages. This procedure not only yields equal weights for each judge independently of his/her scale use, but it also ensures that the transformed scores of each judge are directly comparable, as they now lie in the same range. RESULTS The variation introduced by the shaving devices and the subjects generated relatively broad ranges of skin and stubble parameters. Average stubble length (L) was found to be within a range of 0-300 microns, while the hair density (N) varied between 19 and 55 hairs/cm 2, and the stubble orientation (O) between 0 and 60 degrees. The skin roughness (S.,) varied between 50 and 110 microns, skin greasiness (S) varied between 0 and 190 pg/cm 2, and the D-squame measurements comprised the full range of the 1-5 category scale. Though not requested, the judges mostly used up-and-down finger movements to judge smoothness. Their transformed smoothness scores spanned the range between 2 and 10. We imported all instrumental parameters (L, N, O, S a, D, F, and S) into a multiple regression model (SPSS) to calculate which parameters add most to the prediction of average smoothness judgments. With a stepwise optimization procedure a model with significant contributions of L, O, D, and N was found, resulting in an R 2 value of 0.49, indicating that the four parameters together succeed in explaining 49% of the variance in the data. We find that L takes 22% for its account, followed by O with 16.2%, and D-squame and N with 6.2% and 5.4%, respectively. The model (see Table I, first row) is such that tactile smoothness is increased through a reduction of L or of N, both as Table I Results of Average Score and Individual Multiple Regression Analyses N L D O S• F S R 2 All judges -0.0368 -0.00547 0.425 0.0261 -- -- -- 0.49 Judge 8 -- -0.00817 -- 0.0349 -- -- -- 0.25 Judge 1 -- -0.00618 -- 0.0385 -- -- -- 0.21 Judge 2 -- -0.00693 -- 0.0249 -- -- -- 0.23 Judge 7 -- -0.00663 0.446 .... 0.27 Judge 9 -- -0.00555 0.450 .... 0.34 Judge 3 -0.0272 -0.00487 0.451 0.0172 -- -- -- 0.54 Judge 5 -0.0382 -0.00504 -- 0.0345 -- -- -- 0.42 Judge 4 -0.0535 -- 0.608 0.0325 -- -- -- 0.38 Judge 6 -0.0950 -- 0.981 -- 0.0502 -- -- 0.32 The columns depict the unstandardized regression coefficients for all objective parameters entered as variables in the multiple regression analysis as calculated for the best fitting model for each of the individual observers. If no coefficient is indicated, the regression analysis did not include that variable in its best fitting model. The last column gives the R 2 values of each analysis, indicating the fraction of variance explained by the model. The first row indicates the values found for the averaged judgments of all nine judges.
Purchased for the exclusive use of nofirst nolast (unknown)
From: SCC Media Library & Resource Center (library.scconline.org)