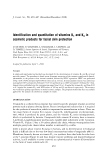
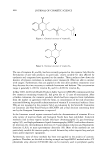
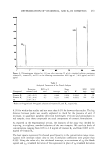
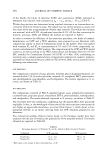
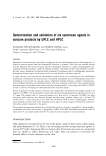
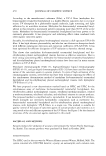
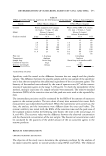
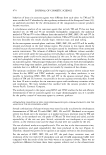
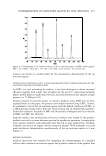
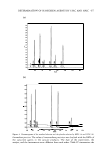
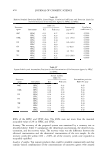
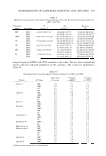
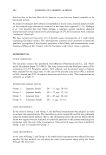
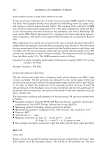
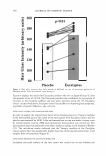
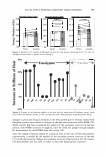
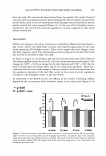
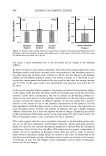
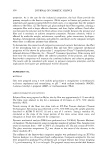
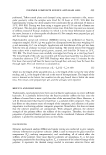
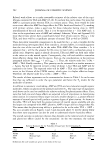
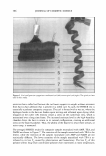
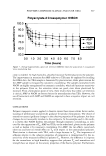
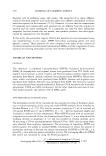
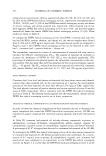
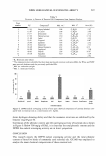
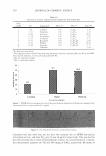
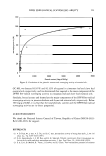
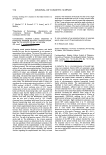
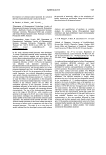
476 JOURNAL OF COSMETIC SCIENCE ag Q ag ci I :i l/J I- I- 1 00 2.0[ 3CO l.OC 5 00 E. :X:• 700 9 00 ·c ro t.lrutK Figure 3. Chromatogram of the standard solution of the six sunscreen agents by UPLC. Peaks (µg/ml): IMC = 35.2, OMC = 67.8, OS = 60.1, OT = 31.0, TM = 36.2, and TS = 47.5 (310.0 nm). was mentioned in the validation studies above. Figure 4 shows HPLC and UPLC chromatograms of the standard solution and the placebo solution. As there was no significant interference in the chromatogram of the placebo solution, the specificity could be considered to be suitably validated for the proposed system. Linearity. Five standard solutions of different concentrations were prepared for the lin earity test. The solutions contained six sunscreen agents in which the concentration ranged from 5 µg/ml to 200 µg/ml, and the corresponding contents of active in the suncare products were from 0.25% to 10.0%. Each solution was injected three times and the calibration curve of each standard solution was analyzed by the least squares method. The test result was evaluated by the R 2 value of the regression line. Table III summarizes the observed R 2 values of HPLC and UPLC. The values were not less than 0.999, and therefore the linearity of the proposed method could be regarded as qualified. Repeatability. The sample solution from a cream A was injected to obtain the peak area and the retention time. Six injections were performed in a row to calculate the RSDs of the peak area and the retention time. Table III summarizes the observed RSDs of the HPLC and UPLC data. The RSDs were significantly smaller than 2% for the peak area and the retention time in the HPLC and UPLC system. System stability. The stability of the HPLC and UPLC system could be verified by measuring the RSDs of the retention time and the peak area of the standard solution in specific time frames, such as in the initial stage, 24 h, and 48 h. The RSDs of the peak area and the retention time were calculated. Table IV summarizes the observed RSDs of HPLC and UPLC. The RSDs of the peak area and the retention time were not more than 2% in both HPLC and UPLC. We could conclude that HPLC and UPLC constitute a stable system for the analysis of sunscreen agents.

DETERMINATION OF SUNSCREEN AGENTS BY UPLC AND HPLC 477 (a) •,34 •,J2' ,JO- •.2e- •,2& •.24 •,22: •,2D- •.1&: •.1&- •.14 •-12: •.1D- •.�&: •.�&: a; .. � r-- ! ·-�' O! V ... � � , .. ro •.:I� � � 8 0 '·- . � - - - - L I I z.co 6.00 (b) ! • 5 D.111 1.IID 2.0D 3.111 4.111 - qo � ... � - - I 8.00 lllni.15 !i ,d j! 5.811 MnlN §! oi - Ii.Ill - I I ,o.oo 1:HO I ... � 7.111 UD 9.0D 10.0D Figure 4. Chromatograms of the standard solution and the placebo solution by HPLC (a) and UPLC (b). Intermediate precision. The value of intermediate precision was checked with the RSDs of the sunscreen agents in the suncare products. The date of the experiment, the analyst, and the instruments were different from each other. Table IV summarizes the
Purchased for the exclusive use of nofirst nolast (unknown)
From: SCC Media Library & Resource Center (library.scconline.org)