DETERMINATION OF VITAMINS K 1 AND K3 IN COSMETICS 461 control laboratories with the aim of verifying the presence of the two vitamins K in facial creams. EXPERIMENTAL REAGENTS AND CHEMICALS All reagents were of analytical-reagent grade and were used without further purification. Methanol and acetonitrile were purchased from Carlo Erba (Milan, Italy), menadione and phytomenadione were obtained from Alfa Aesar (Karlsruhe, Germany), bis-ethyl hexyloxyphenol methoxyphenyl triazine (LS.) was from Ciba (Basel, CH), and dimeth ylacetamide was from Lab Scan (Dublin, Ireland). Water was deionized and doubly distilled from a glass apparatus. All solvents and solutions for HPLC analysis were filtered through a Millipore filter (pore size 0.45 µm) and vacuum degassed by an ultrasound treatment before use. APPARATUS HPLC analysis was performed with an Agilent 1100 Series liquid chromatograph, consisting of a delivery pump with the online degasser, an injector with a variable loop, and a photodiode array detector. The equipment was managed by the "Chemstation, revision A.08.03" software (Agilent Technologies). The analytical column was stainless steel (150 x 4.6 mm) packed with a 3.5-µm Zorbax Eclipse XDB C18 (Agilent Tech nologies). A linear gradient elution was carried out, with solution A consisting of acetonitrile-methanol (ratio 75:25 v/v) and water, starting from 50% solution A. This composition was maintained for 5 min, and then a linear gradient up to 100% solution A was maintained for 5 min. This final composition was kept for 15 additional minutes before re-equilibrating the column. The flow-rate was 1.0 ml/min, the injection volume was 20 µl, and the column tem perature was 40 ° C. The preferential detection wavelength was 3 3 3 nm. The range of wavelengths examined by the photodiode array detector was 240-350 nm. CALIBRATION The calibration graphs were constructed from triplicate injections of six solutions of different concentration. Stock solutions of vitamins K1 and K3 were prepared by dis solving a weighed amount (about 1.0 g and 0.1 g, respectively) of the pure compounds in 5 00 ml of methanol. One hundred sixty milligrams of the internal standard was accurately weighed and dissolved in 10 ml of dimethylacetamide, and the solution was taken to 5 00 ml with methanol. A set of working solutions was obtained by diluting, in a 50-ml volumetric flask, aliquots of the stock solutions (1, 5, 10, 15, 20, and 25 ml) with 25 ml of the I.S. solution and bringing them to volume with methanol. These dilutions were chosen on the basis of the possible amounts utilized in the cosmetic formulations. All the ma nipulations were carried out in the dark, and the solutions were kept at 4°C in the

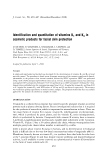
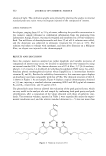
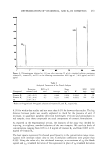
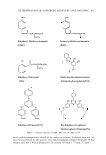
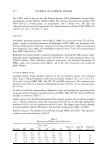
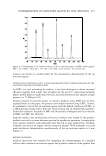
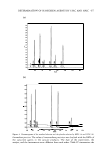
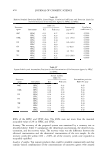
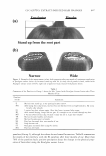
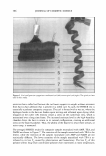
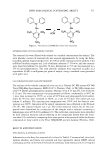
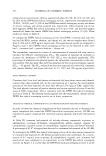
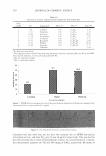
462 JOURNAL OF COSMETIC SCIENCE absence of light. The calibration graphs were obtained by plotting the analyte to internal standard peak-area ratios versus microgram injected of the compound of interest. SAMPLE PREPARATION An aliquot, ranging from 0.2 to 2.0 g of cream, reflecting the possible concentration in the cosmetic sample (obtained as confidential information from the producing firm Laboratoires Auriga, France), was exactly weighed and transferred to a 50-ml volumetric flask. Ten milliliters of dimethylacetamide and then 25 ml of LS. solution were added, and the dispersion was subjected to ultrasonic treatment for 10 min at 3 5 °C. The solution was taken to volume with methanol, and then after filtration on a Millipore filter, an aliquot was injected in the chromatograph. RESULTS AND DISCUSSION Since the cosmetic matrices analyzed are rather lipophylic and variable recoveries of compounds of interest may occur, we decided to quantitate the two vitamins by using an internal standard (LS.). The chosen substance was a UV-A filter, 2,2' -[6-(4-methoxy phenyl)-1,3,5-triazine-2,4-diyl}bis[S-[(2-ethylhexyl)oxy }phenol (INCI name: bis-ethyl hexyloxy phenol methoxyphenyl triazine) whose lipophilicity is intermediate between vitamins K 1 and K 3 . Besides the solubility characteristics, this sunscreen agent displays an absorbance spectrum comparable with that of VKs. The chemical structure of the LS. is shown in Figure 3. As an example, Figure 4 displays a typical chromatogram, obtained at 333 nm, injecting a standard solution containing 800.0 and 80.0 µg/ml of vitamins K1 and K 3 , respectively, and 16 µg/ml of LS. The photodiode array detector allowed the evaluation of the peak purity factors, which are very useful in the analysis of a real sample by confirming both peak purity and peak identification, after a comparison of the values obtained with those of authentic stan dards. The retention volumes, reported in Table I, were reproducible under the experi mental conditions used, and the relative standard deviation (n = 5) was not more than Figure 3. Chemical structure of I.S.
Purchased for the exclusive use of nofirst nolast (unknown)
From: SCC Media Library & Resource Center (library.scconline.org)