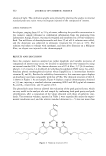
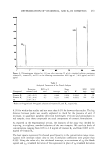
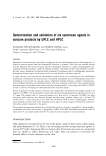
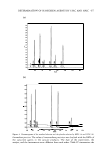
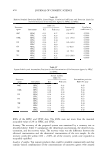
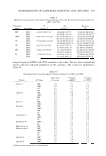
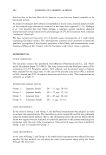
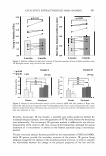
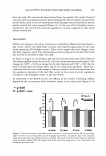
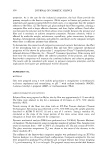
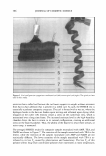
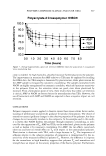
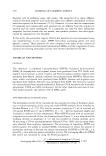
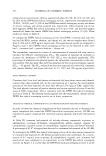
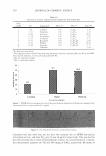
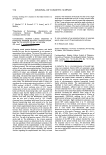
DETERMINATION OF VITAMINS K 1 AND K3 IN COSMETICS 463 mAU ll • �--4,/,,, __ _jl, _____________ �---------------__, ·�-,~-�-·•-- 20 min Figure 4. Chromatogram obtained at 333 nm, after injecting 20 µl of a standard solution containing vitamin K1, vitamin K3, and LS. at the following concentrations: 800.0 µg ml- 1 , 80.0 µg/ml, and 16.0 µg/ml. Table I Analytical Parameters of the Tested Analytes Retention RSD in% Slope LOD LOQ Compound volumesa (ml) area a Intercept (µg- 1 ) R2 (ng) (ng) Vitamin K3 3.45 ± 0.01 0.4 0.040 0.026 0.9994 20 50 Vitamin K 1 27.05 ± 0.06 0.5 0.211 0.005 0.9991 100 250 LS. 22.97 ± 0.5 a Refers to 60-µg/ml and 600-µg/ml solutions of vitamins K3 and Ki, respectively. 0.2% for within-day studies and not more than 0.3% for between-day studies. The big distance between peaks was usually exploited to check for the presence of and, if necessary, to quantitate parabens (detection wavelength: 254 nm) and antioxidants in real samples, since these compounds are usual components of cosmetic formulations. As reported in the Experimental section, the linearity of the assay was checked by injecting, in triplicate, standard solutions of the two vitamins. We used six levels of concentrations ranging from 0.05 to 1.0 mg/ml of vitamin K 1 and from 0.005 to 0.1 mg/ml of vitamin K 3 . The least square regression fits showed good linearity in the concentration range inves tigated, with intercept values close to zero. Correlation coefficients were greater than 0.999. Using the value of a, the calculated intercept, as an estimate of YB (the blank signal) and s y /x (standard deviation of the regression) in place of sB (standard deviation

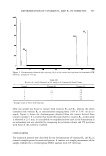
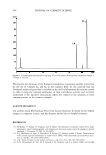
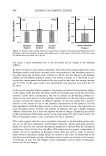
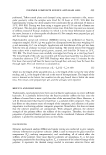
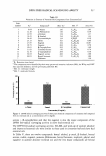
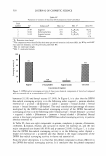
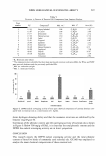
464 JOURNAL OF COSMETIC SCIENCE of the blank), the limits of detection (LOD) and quantitation (LOQ), expressed as nanogram (ng) injected, were calculated as YB + 3 sy/x and YB + 10 sy/x (Table I). Within-day precision was determined using standard solutions at an intermediate con centration within the linearity range. The sample was run on five separate occasions over the course of the day at approximately 60-min time intervals. The within-day variation was minimal, with an R.S.D. of peak areas lower than 0.5%. All the data concerning the linearity, precision, LOD, and LOQ of the method are reported in Table I. In order to evaluate the efficiency of the extraction procedure, two kinds of cosmetic formulations, an O/W and a W/O emulsion, were prepared in our laboratory with compositions similar to those of formulations found on the market. They were spiked with vitamins K 1 and K3 at concentrations of 5% and 0.5% (w/w), respectively, ex tracted, and submitted to HPLC analysis. The compositions of the O/W and W/O model cosmetics, written according to the INCI nomenclature and European Directive 7 6/7 68/ EEC modified by Commission Decision 96/335/EC of 8 May 1996, establishing an inventory and a common nomenclature of ingredients employed in cosmetic products, amended by Commission Decision 2006/25 7 /CE of 09.02.2006, were as presented in the following two subsections. 0/W EMULSION The composition consisted of aqua, glycerin, butylene glycol dicaprilate/dicaprate, de natured alcohol, Cl8-36 acid triglyceride, ceteareth 20, tocopherol, BHT, phenoxyetha nol, methylparaben, propylparaben, and butylparaben. The results, expressed as % re covery, are shown in Table II. W /0 EMULSION The composition consisted of PEG-8-caprylate/caprate, aqua, polyglyceryl isostearate, cyclomethicone, propylene glycol, tetrasodium EDTA, phenoxyethanol, methylparaben, and ethylparaben. The results obtained, expressed as % recovery, are shown in Table II. The recoveries were very satisfactory, confirming that the matrix effects were practically negligible. In fact, at the wavelength of detection all the other emulsion constituents do not display an appreciable absorbance, as evinced from Figure 5, which shows a chro matogram relevant to an extract deriving from the O/W emulsion prepared in our laboratory. Five commercial samples of facial creams found on the European market have been analyzed with the aim of verifying the applicability of the proposed method. The results obtained are reported in Table III. Table II Percentage Recoverya of Vitamins K 1 and K 3 Added to Model Cosmetic Products Compound Vitamin K3 Vitamin K 1 O/W emulsion 97.6 ± 2.8 98.4 ± 2.1 a Each value is the average of three determinations ± S.D. W/O emulsion 99.6 ± 1.9 98.9 ± 2.0
Purchased for the exclusive use of nofirst nolast (unknown)
From: SCC Media Library & Resource Center (library.scconline.org)