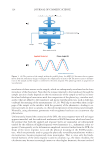
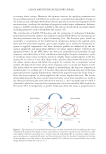
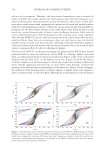
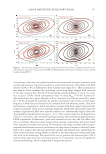
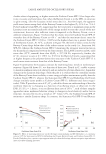
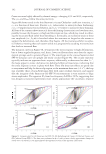
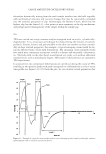
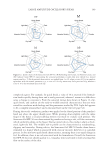
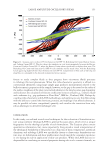
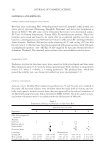
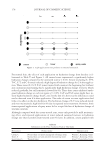
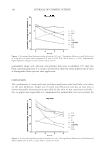
JOURNAL OF COSMETIC SCIENCE 126 the shear strain rate. In summary, because the strain rate is the time derivative of strain, a line is produced in a stress versus strain Lissajous plot for an elastic sample (elastic Lis- sajous plot, see Figure 2A), and a line is the result of a stress versus shear rate Lissajous plot for a perfectly viscous material (viscous Lissajous plot, see Figure 2B). Outside the LVR, phase shifts and/or increases in contributions from higher stress har- monics (as evidenced by a distortion in the sinusoidal shape of the measured stress wave) produce distorted-elliptical loop shapes within the many-looped Lissajous plot that vary with the changing strain steps within the dynamic strain sweep experiment. In other words, a soft, yet structured, sample may appear elastic within its LVR, but may then demonstrate changes in structure as a function of increasing strain such that its last loop will suggest a completely viscous response. Additional trends include a clockwise “tilt” in the loops as a function of increasing strain, which is an indication of softening of the bulk material furthermore, deviations from ellipticity, especially with upward/down- ward pointing tips, refl ect intracycle strain stiffening (16). Many materials become stiffer when a stress is applied—where intracycle strain stiffening conveys a material’s local, nonlinear elastic response within the span of a single oscillation step. Finally, to get a better understanding of the instrumentation and variation in the tran- sient shear rates encountered in a dynamic strain sweep step, if the absolute value of the stress response is considered as a function of strain, the maximum stress typically occurs at the maximum controlled strain (see Figure 2A), and the lowest measured stress is produced at 0% strain. Now, switching to the shear rate plot (see Figure 2B), the shear stress peaks at the maximum shear rate—or, more simply, at the highest angular velocity. Note the symmetry of the Lissajous loops around zero shear rate, where the stress maxima (think absolute value) are encountered at both the negative and positive shear rate boundaries for each oscillation step (Figures 1B and 2). To add more complexity to the mental picture, the maximum shear rate occurs at 0% strain, as the motor driving the sample deformation moves midway between the strain maxima (imagine a swinging pendulum at the bottom of its arc). Additionally, the angular velocity is zero at the maximum strain because the motor driving the sample physically stops for a moment to shift directions (imagine a swinging pendulum coming to a temporary halt at the top of its arc) hence, as the motor twists and turns during a single oscillation step, there are subtle differences in motor velocity that translate into vari- ations in oscillatory shear rate. DFT AND CHEBYSHEV POLYNOMIALS FT-rheology involves decomposition of the raw stress response into its individual har- monics (Eq. 2). ( )= σ ω γ σ ω φ σ ω φ σ ω 1 1 1 3 1 3 5 1 , sin + + sin 3 + + sin 5 +φ5)+! ( ) ( ) ( t t t (2), where σ, γ, ω, and t have already been defi ned as the stress, strain, angular frequency, and time, respectively, and φi corresponds to the phase difference between the applied strain and the harmonic components of the stress response. In a nutshell, equation (2) suggests that the nonsinusoidal response in LAOS is best contained and described by a series of parametric terms in which the frequency contributions from the higher harmonics

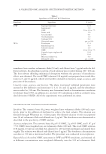
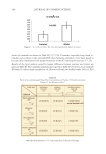
LARGE AMPLITUDE OSCILLATORY SHEAR 127 are proportioned with the fundamental harmonic to best fi t the shape of the deformed wave. The odd harmonics are then extracted, and the resultant frequency data are subsequently recasted into nonlinear parameters—instead of just G’, G”, tan δ, etc.—as a function of the originally applied strain magnitude (or shear rate). The nonlinear materials properties include nonlinear elastic moduli (G’L and G’M), the strain-stiffening ratio (S), and the shear-thickening ratio (T). G’L is a measure of the elasticity at large strains, whereas G’M is the residual elasticity of a material as it fl ows at the highest oscillatory shear rate. Consequently, the nonlinear coeffi cients facilitate a more com- plete description of the local or instantaneous stress response during the sweep of a single oscillation, whereas traditional rheology focuses on the average stress response to the deformation. As sensorial processes are dynamic, it can be argued that panelists sense the most extreme relative rheological transitions, and that an understanding of the divergence in nonlinear parameters is critical to successfully garnering correlations. Finally, from the isolated odd harmonics, the total stress (σ) can be subsequently recasted as temporal data and separated into its elastic (σ‘) and viscous (σ”) compo- nents. Using an application of orthogonal Chebyshev polynomials, Ewoldt and McKinley pro- vide a means for the physical interpretation of a nonlinear stress response, with a means to methodically characterize nonlinear elastic (en) and viscous (vn) parameters (where n = 1st, 2nd, 3rd, etc., harmonic intensities). The result nets the Chebyshev intracycle, or local, viscous, and elastic coeffi cients, where e3 = 0 and v3 = 0 in the LVR further e3 0 implies strain softening, e3 0 indicates strain stiffening, v3 1 describes shear thinning, and v3 0 corresponds to shear thickening (16). In addition, the coeffi cients also enable a direct mathematical connection between the Chebyshev and Fourier nonlinear param- eters, thereby giving physical meaning to the Fourier parameters. Summing up, the in- tracycle coeffi cients represent coeffi cients describing the dynamic, local variations in the dissipative and elastic phenomena as a function of shear rate within an oscillation cycle. MATERIALS AND METHODS In this study, we investigated the rheological behavior of four fi nished formulation proto- types having unique textural properties. SAOS, LAOS, and other rheological data were generated for the four systems. The data obtained from rheology experiments were com- pared to textural data obtained by texture profi le analysis. The validity of the instrumen- tal techniques to accurately describe specifi c texture characteristics for each formula was challenged by sensorial analysis. FORMULATIONS Four distinct formulation systems were evaluated in this study, namely an alcohol-based sunscreen gel, a gel cream, an o/w SPF-15 cream, and an o/w emulsion with a higher wax phase. Sunscreen Gel SPF-50. The product is created by gelling sunscreen fi lters, light esters (Ceraphyl™ Ashland, Inc., Covington, KY), and alcohol with lightly crosslinked poly(vinyl pyrrolidone) (FlexiThix™ Ashland, Inc.) (Table AI, Appendix 1).
Purchased for the exclusive use of nofirst nolast (unknown)
From: SCC Media Library & Resource Center (library.scconline.org)