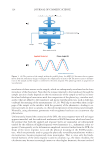
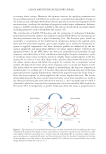
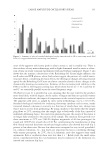
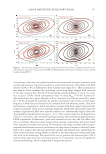
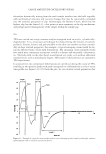
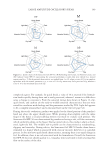
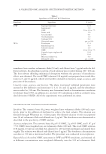
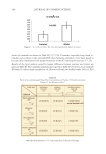
JOURNAL OF COSMETIC SCIENCE 128 Refreshing Gel Cream. This emulsifi er-free o/w gel cream is created by combining two polymers, namely poly(acrylic acid/vinyl pyrrolidone) crosspolymer (UltraThix™ P-100 Ashland, Inc.) and cetyl hydroxyethylcellulose (PolySurf™ CS 67 Ashland, Inc.) with shea butter, light esters, and a few emollients (Table AII, Appendix 1). Cushion Cream SPF-15. This bouncy o/w cream is achieved by combining lightly cross- linked poly(vinyl pyrrolidone) (FlexiThix™ Ashland, Inc.) with sodium polyacrylate (Covacryl MV 60 Sensient Cosmetic Technologies, Saint-Ouen-l’Aumône, France) and a mixture of nonionic and anionic emulsifi ers, plus several ultraviolet fi lters and skin mois- turizers (Table AIII, Appendix 1). Buttery Cream. This o/w buttery texture is achieved by the combination of a lamellar gel technology based on glyceryl stearate (and) behenyl alcohol (and) palmitic acid (and) stearic acid (and) lecithin (and) lauryl alcohol (and) myristyl alcohol (and) cetyl alcohol (Prolipid™ 141 Ashland, Inc.), various long-chain esters (Ceraphyl™ Ashland, Inc.), and a relatively hydrophobic polymer, cetyl hydroxyethylcellulose (Natrosol™ Plus Ashland, Inc.). A secondary polymer (Stabileze™ QM Ashland, Inc.) is also added to the water phase of this cream for enhanced stabilization (Table AIV, Appendix 1). RHEOLOGICAL CHARACTERIZATION The rheological properties of the four prototypes were characterized using a strain- controlled ARES-G2 rheometer and a stress-controlled AR-G2 rheometer (TA Instruments, New Castle, DE). Rheological tests (n = 3) were carried out at 25° ± 0.1°C and 32° ± 0.1°C. Fresh samples were used for each test, and zeroing of the transducers was carried out before each trial to make certain that Lissajous overlays were repeatedly centered at the stress versus strain (shear rate) origin. Data analysis was completed using TRIOS software with the FT Analysis option, and Rheology Advantage (TA Instruments). To minimize structural changes or introduction of air bubbles during sample loading, an unvarying routine for sample loading was applied. The sample was scooped onto the bottom plate, after which the top plate was slowly lowered to the gap at a rate of 0.05 mm/s. After adjustment of the gap (H = 1.00 mm) and a 2-min equilibration to alleviate excess nor- mal forces (Nf 10 g), the sample edges were trimmed to minimize edge effects. Before data collection, a 3-min delay was applied to ensure replenishment of the compromised structure. Both smooth and rough plate surfaces were used for most rheological testing to evaluate how the contribution of edge effects, wall slip, shear banding, and/or plug-fl ow processes contribute to the meaning of the data. When rough plate surfaces were used, the sandpaper was changed after every trial. Details of the methodology for the employed rheological measurements are discussed in the sections below. Dynamic strain sweep. Using the ARES-G2 and smooth plates, the oscillation amplitude was ramped from 0.1% to 600% strain at both 25° and 32°C to probe the effect of tem- perature on the length of the LVR plateau the experiments were completed at 1 and 50 rad/s to see the effect of the applied frequency (and oscillation shear rate) on the results. The 2nd (I2/I1), 3rd (I3/I1), 4th (I4/I1), and 5th (I5/I1) harmonic intensities were followed as a function of oscillation strain. Higher order harmonics (e.g., I2, I3, I4, I5) typically appear with the onset of nonlinear changes in the sample structure. Even harmonics (e.g., I2, I4) are useful indicators for identifying the presence of asymmetrical wall slip, shear banding,

LARGE AMPLITUDE OSCILLATORY SHEAR 129 sample loss, and yield, as well as other nonperiodic fl ow instabilities—where dynamic oscillation of the material invokes an asymmetrical stress response to the direction of the applied strain oscillation. Odd harmonics (e.g., I1, I3, I5), on the other hand, refl ect sym- metrical stress responses, such as homogeneous changes in microstructure, which are in- dependent of the direction of oscillation. Dynamic frequency sweep. Using the ARES-G2 and 25-mm parallel plates (smooth and rough surfaces), frequency sweeps were applied at 25° and 32°C to gauge the inherent viscoelasticity as a function of time, where time is inversely proportional to 1/f. The angu- lar frequency was swept from low to high (0.1–100 rad/s) within the LVR (γ = 1% strain) and, in other experiments, well outside the LVR (γ = 50%). Preshear and recovery. Experiments were performed using the ARES-G2 rheometer. The method involves preshearing the sample at a moderate shear rate, followed by a dynamic time sweep to monitor the rebuilding of structure as a function of time. The time depen- dence of structure rebuilding is related to thixotropy. Using both smooth and roughened surfaces, the following settings were applied: preshear = 20 s-1 for 180 s recovery = dynamic time sweep (10 min, 1% strain, 1 rad/s) to monitor trends in G’ as a function of time. Steady torsional. Steady torsional experiments were performed with smooth and rough surfaces using the ARES-G2 rheometer. The shear rate was stepped to 20 s-1 and held steady for 300 s trends in stress and viscosity were followed as a function of time. The test was performed to monitor thixotropy, which is time-dependent shear thinning. Step stress growth. The step growth experiment was performed using the ARES-G2 rheom- eter. The test is transient, where an instantaneous shear strain rate is applied to gauge the initial elasticity. The shear rate was instantaneously stepped from 0 to 50 s-1 and held constant for 300 s using both smooth and rough plate surfaces. Stress ramp. The steady stress ramps were performed using the AR-G2 rheometer. Stress ramps were applied with a stress-controlled rheometer to directly assess the apparent yield stress (τ0) and zero shear viscosity (ZSV) of each material. All four cosmetic formulations exhibit apparent yield stress responses, meaning that their dispersed skeletal microstruc- tures were strong enough to appear solid-like in a jar, and that they actually tend to creep or fl ow very slowly under the application of miniscule shear stresses (i.e., long deforma- tion times). Consequently, the associated fl ow curves portray a ZSV plateau rather than an infi nite viscosity in the limit of zero applied shear rate. Furthermore, only smooth sur- faces were studied, so wall slip and plug fl ow values are comingled in the reported appar- ent yield stress values hence, in the report “yield stress” is sporadically used, but the data are more accurately termed as “apparent yield stress events.” The yield stress was mea- sured at both 25° and 32°C to see the effect of temperature on the τ0 and potential cor- relation with cushion and initial spreadability. The conditioning step included thermal equilibration followed by the application of a small stress (0.100 Pa) for 2 min to build up stress in the material. The shear stress was then ramped from 0.010 to 200 Pa. For each stress measurement, the maximum point collection time was limited to 1 min to curtail drying of the sample at the gap edge. Brookfi eld viscometry. The apparent viscosity of the formulations was measured with a Brookfi eld RVT viscometer and the appropriate T-Bar spindle (Brookfi eld Engineering Laboratories, Inc., Middleboro, MA). The measurement was recorded after equilibrating at 5 rpm and 25°C for 1 min.
Purchased for the exclusive use of nofirst nolast (unknown)
From: SCC Media Library & Resource Center (library.scconline.org)