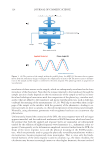
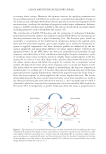
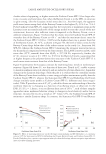
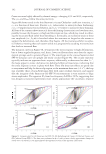
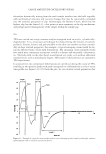
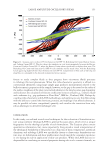
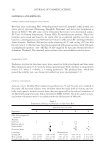
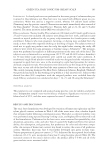
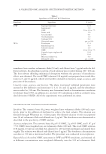
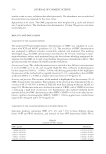
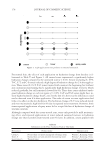
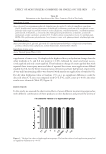
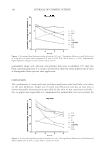
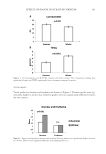
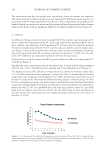
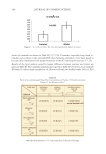
JOURNAL OF COSMETIC SCIENCE 180 every approach by comparing the signifi cant difference to the control. Among the seven applications, cream applied with toner as replenishment for three times led to greatest hydration change rate compared with other zones on normal skin. Th e integrated emul- sion formulation within cream demonstrated superior moisturization among the occlu- sive formulation such as petroleum jelly, which forms a layer on skin surface and retards the evaporation of water and diffuses into the intercellular lipid domains, simultaneously. Anhydrous, natural petroleum jelly reduces water loss by more than 98%, while other oils only manage a 20–30% reduction (9,12). In addition, repeated applications of toner containing potent humectants, for instance, sodium hyaluronate, also contributed to wa- ter retention. Although the consequence of re peated applications of toner for dry skin was not clear, the effect of wa ter evaporation was greater on dry skin. On the other hand, cream applied with spray water (almost pure aqua) repeated for three times as supplement represented a quicker descent rate of hydration, which confi rmed that the spray water without any humectants or occlusives had instant smoothing, com- forting, and refreshing actions, but promoted a heavier water evaporation instead of reducing water loss, and its cleansing action that might wash off the cream (lipids) previ- ously applied weakened th e moisturizing effect further. Therefore, repeated applications of spray water (almost pure aqua) reduced original moisturization of cream. C+T and T+C zones expressed similar hydration rates since two products were applied 2 h later. It suggested that no matter whether the application order was either cream before toner or toner before cream (the interval was a few minutes), hydration was similar when the same quantity of the mixture of cream and toner was applied. No signifi cant difference could be detected when compared with cream only, implying that the moistur- izing effect of mixture of cream and toner is mainly determined by cream, and toner merely plays a supporting role. The skin hydration might reach saturation after “evapora- tion phase” (13) for these two products. It is speculated that for each zone of skin in a different environment, hydration reaches a peak (due to the property of moisturizer), then gradually declines (14) owing to water fl ux and re tention that exist on the skin and main- tain homeostasis. Humectants promote water retention within stratum corneum. Emollients increase the water content in the stratum corneum not only by delivering their water to the skin, but also by forming an occlusive layer, resulting in an increase in skin hydration ( 15). While shortly after skin application, emulsions break and (related to their water concentration) most of the incorporated water evaporates (16), thereby providing a dynamic balance between water retention and evaporation physically, extremely infl uenced by inside and outside circumstances. Hence, toner provides immediate hydration through its water content, and as water evaporates, skin hydration reduces. Even predominant hu mec- tants barely retain water within stratum corneum. Some ingredients, such as trimethyl Table IV Distribution of Test Subjects with Mean Corneometer Values at Baseline Skin type Values (a.u.) Maximum Minimum Average Dry skin (n = 18) 34.90 26.21 30.54 ± 2.57 Normal skin (n = 22) 49.22 35.18 40.33 ± 4.25

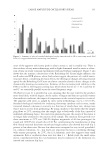
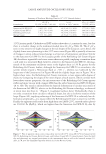
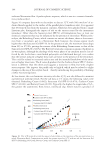
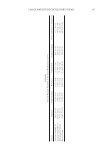
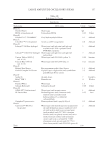
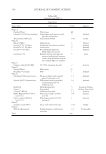
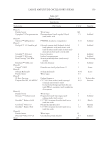
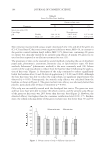
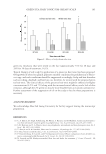
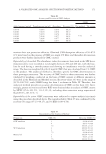
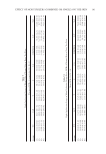
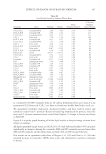
Table VI Eight Application Groups of Mean Hydration Change Rates, HCRs of Normal Skin at Every Test Point Mean HCR (%), N = 18 Groups T-T C+ T C C-S CONTROL C-T T+ 2 h 25.68 ± 21.05 74.37 ± 24.98 27.25 ± 17.51 68.71 ± 21.43 67.84 ± 28.95 1.81 ± 6.40 62.06 ± 24.26 79.24 ±30.80 4 h 34.86 ± 19.68 60.02 ± 22.90 21.81 ± 13.91 55.45 ± 15.03 37.77 ± 21.27 1.30 ± 4.70 51.28 ± 22.60 60.9 ± 22.48 6 h 36.29 ± 20.00 47.52 ± 18.67 17.77 ± 11.75 44.33 ± 14.31 23.03 ± 17.95 1.54 ± 5.90 50.2 ± 20.61 51.81 ± 24.11 8 h 44.04 ± 23.86 40.88 ± 18.63 11.35 ± 13.86 37.39 ± 13.57 18.96 ± 16.86 1.63 ± 5.35 48.28 ± 20.58 43.53 ± 18.13 Table V Eight Application Groups of Mean HCRs of Normal Skin at Every Test Point The mean HCRs of normal skin (%), N=22 Groups T-T CT+ T C C-S CONTROL C-T T+C 2 h 27.24 ± 10.06 62.17 ± 17.52 25.55 ± 11.28 58.74 ± 15.54 56.95 ± 17.00 0.57 ± 5.88 56.9 ± 14.24 61.09 ± 30.50 4 h 35.19 ± 12.09 49.83 ± 18.76 20.66 ± 12.35 51.38 ± 14.80 43.02 ± 18.40 0.35 ± 4.50 54.75 ± 19.84 50.7 ± 21.87 6 h 41.08 ± 11.24 40.86 ± 19.16 16.65 ± 10.46 43.02 ± 16.29 33.77 ± 19.68 -0.38 ± 5.66 55.9 ± 17.98 42.44 ± 23.10 8 h 43.24 ± 12.64 35.35 ± 18.62 12.98 ± 12.15 35.87 ± 16.32 24.63 ± 17.42 -1.44 ± 5.46 53.84 ± 13.25 34.21 ± 17.70 EFFECT OF MOISTURIZERS (COMBINED OR SINGLE) ON THE SKIN 181
Purchased for the exclusive use of nofirst nolast (unknown)
From: SCC Media Library & Resource Center (library.scconline.org)