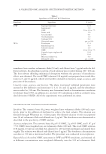
EFFECTS OF SEASON ON STRATUM CORNEUM 189 Analysis of skin proteins from D-Squame discs. D-Squame discs were extracted with PBS containing 0.2% sodium dodecyl sulfate and 0.5% propylene glycol for 30 min with sonication on ice. The extracts were then centrifuged for 5 min at 2100 × g to remove skin solids that might interfere in the assay. Subsequently, the extracts of D-Squame discs were transferred into 96-well polypropylene deep-well plates and frozen at -80°C for skin multiple analyte profi le (SkinMAP) and soluble protein analyses. Human skin proteins (keratin-1,10, involucrin, human serum albumin) were simultaneously quantifi ed using a 3-plex Human Skin Panel Multiplex Immunoassay Kit (Millipore Corp.). The antibody for human involucrin recognizes non-cross-linked involucrin protein, but may have reac- tivity with involucrin within the cornifi ed envelope. Soluble protein was measured using BCA Protein Assay Kit. Analysis of skin lipids from D-Squame discs. An array of skin lipids (cholesterol, cholesterol sulfate, selected fatty acids, and selected ceramides—see Table III for ceramide nomencla- ture) was determined from extracts of D-Squame discs containing samples from human skin using gradient supercritical fl uid chromatography (SFC) with MS/MS with detection in the positive and negative ionization modes depending on the analyte using atmo- spheric pressure chemical ionization (APCI). The tape strips were fi rst analyzed via a SquameScan™ 850A infrared densitometer to determine the amount of removed skin for normalization of the measured lipids. Two tape strips from each subject were transferred to 20-ml glass vials, spiked with an internal standard mixture [D6-cholesterol, D7-cho- lesterol sulfate, D47-tetradecanoic acid, D3-heptadecanoic acid, D7-sphinanine, and D31- N-palmitoyl-1-D-erythro-sphingosine (D31-Ceramide)] and extracted using 3 ml of methanol followed by sonication at ambient temperature. The vials were centrifuged, and the methanol layer removed and placed in separate glass vial. The tape strips were then extracted with 3 ml of hexane followed by sonication for 15 min at ambient temperature, and the hexane layer was separated. The hexane and methanol layers for each set of tapes were then combined, dried under nitrogen at 50°C, and fi nally reconstituted in chloroform:MeOH (3:1 v/v). Standards [myristic acid, palmitic acid, palmitoleic acid, octadecanoic acid, oleic acid, linoleic acid, docosanoic acid, tetracosanoic acid, choles- terol, cholesterol sulfate, N(24_0)P(18), N(24_0)DS(18), A(16_0)S(18), A(24_0)P(18), ceramide EOS-C30, S(18)] were prepared in chloroform:MeOH (3:1) over a range of ap- propriate concentrations. The standards, spiked with internal standard, and the reconsti- tuted samples were analyzed by gradient SFC with MS/MS detection using APCI. The fatty acids were monitored in the negative ion mode while selected ceramides, sphingoid bases, cholesterol, and cholesterol sulfate were monitored in the positive ion mode. The peak area ratio (standard peak area/internal standard peak area) for each standard level were used to construct a linear regression curve for each of the standard analytes. For ana- lytes, where the standard was available (fatty acids, cholesterol, cholesterol sulfate, sphin- goid bases), the actual standard was used, whereas for the ceramides the surrogate ceramide for the particular class was used. The lipid mass found for each analyte was divided by the SquameScan values for the corresponding tapes. STATISTICAL METHODS: SKINMAP, NMF, CYTOKINES, AND LIPIDS For each of the four sites within a subject, the SkinMAP (tape 4), NMF (tapes 3 and 10), cytokines (tape 2), and lipids (tape 6 and 7 pooled) measures were normalized to their associated protein measures (BCA for SkinMAP, NMF, and cytokines and SquameScan™

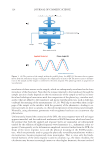
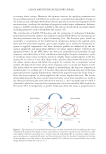
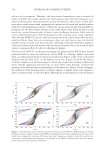
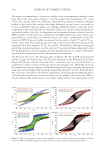
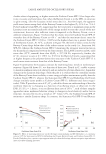
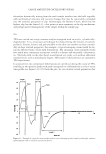
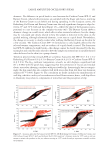
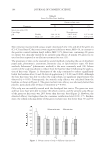
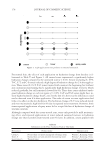
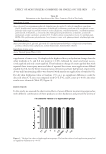
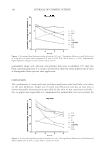
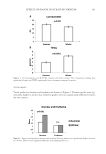
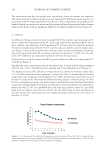
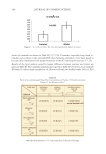
JOURNAL OF COSMETIC SCIENCE 190 for lipids) for each study and log to the base 10 was taken. For values below quantifi able limits (BQLs), half the detection limit was substituted. Following normalization and log transformation, the SkinMAP, NMF, and cytokine data were averaged across all four sites for each subject. Thus, each subject has a summer and a winter measure. These data were then modeled with a mixed model analysis of covariance (ANCOVA) with fi xed effect for time of year (group) and random effect for subject. All statistical tests comparing the two groups (winter vs. summer) were two sided using α = 0.05 signifi cance level. The least squares (adjusted for model) mean (on the log scale), the original mean (before log transformation), p value testing for signifi cant difference in each group mean from zero, standard errors, and p values for testing between group differences were calculated and reported. BQLs are reported and fl agged for greater than 30%. STATISTICAL METHODS: BIOPHYSICAL MEASURES AND VISUAL GRADES The Corneometer, TEWL, Expert Dryness, and Expert Redness data were each averaged across all four sites within the marked skin area for each subject. Thus, each subject has a summer and a winter measure. These data were then modeled with a mixed model ANCOVA with fi xed effect for time of year (group) and random effect for subject. All statistical tests comparing the two groups (winter vs. summer) were two sided using α = 0.05 signifi cance level. RESULTS AND DISCUSSION BIOPHYSICAL MEASURES Electrical measurements for the evaluation of SC hydration are well established, and sev- eral instruments are available (26–28) including the Corneometer (29) which has been shown to give reading correlated to dry skin grades (30). The most common way to assess skin barrier function is through the measurement of TEWL (31–35). Corneometer and TEWL results in summer and winter are shown in Figure 1A and B. Corneometer readings were higher in summer (Figure 1A), indicating a higher level of skin hydration in agreement with the literature (7–13). TEWL was lower in sum- mer compared to winter in agreement with the results reported by Muizzuddin et al. (11), Kikuchi et al. (10), and Wan et al. (7), but in contrast with those reported by Black et al. (8) who found higher TEWL values on the legs and forearms in July com- pared to February and December. Ishikawa et al. reported lower TEWL on the cheeks in summer compared to winter and lower TEWL on the buttocks in spring. On the palm, TEWL values were higher in autumn than in spring, but there were no differ- ence on other body sites investigated including legs (17). In the present study, sub- jects with at least moderately dry skin on the legs after the wash-out period in winter were selected. This may have increased the difference in barrier function seen be- tween winter and summer and led to the highly signifi cant reduction in TEWL in summer seen in Figure 1B.
Purchased for the exclusive use of nofirst nolast (unknown)
From: SCC Media Library & Resource Center (library.scconline.org)