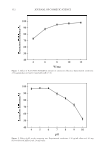
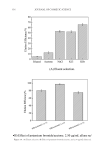
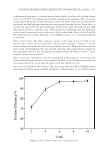
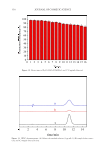
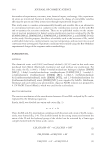
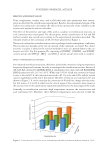
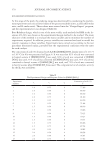
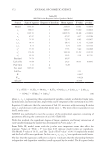
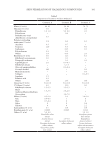
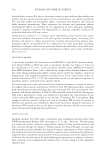
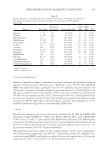
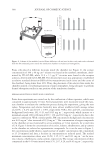
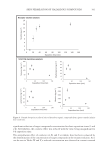
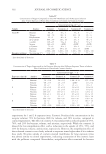
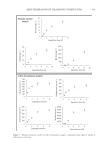
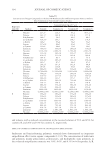
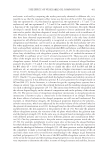
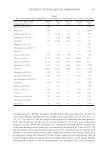
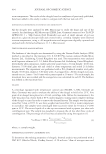
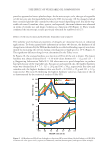
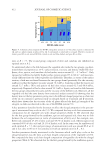
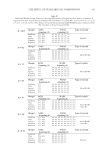
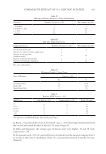
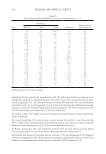
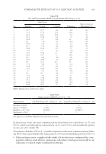
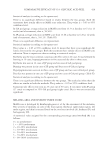
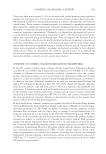
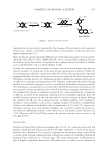
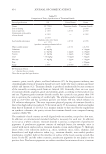
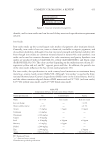
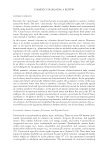
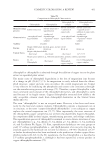
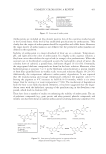
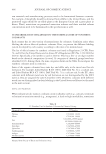
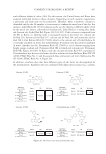
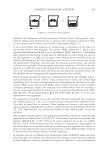
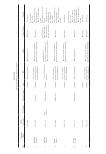
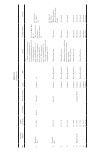
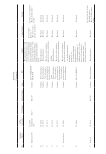
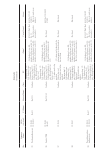
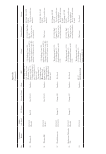
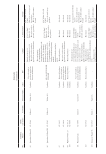
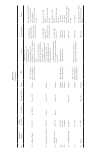
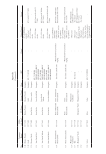
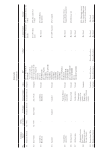
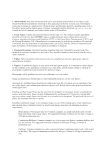
370 JOURNAL OF COSMETIC SCIENCE BOX–BEHNKEN EXPERIMENTAL DESIGN At this stage of the work, the studying range was determined by considering the prelimi- nary experiment and critical limit values of the process variables (time, acid/alcohol molar ratio, and IL molar ratio). These values were entered into the “Design Expert” program, and the experimental set was designed (Table II). Box–Behnken design, which is one of the most widely used methods for RSM in the lit- erature (63–66), was chosen as the experimental design method to be studied. The main objective of this method is to evaluate the many variables and to minimize the number of experiments required. In addition, process variables are examined and used to model the system’s response to these variables. Experiments were carried out according to the test procedure mentioned earlier, provided that the experimental conditions were the same for each catalyst. The conversion of acid (%) obtained with AA:BA:[EMIM] [HSO 4 ] molar ratio of 1:1:0.75 at 110° C for 6 h was presented in Figure 6. It was seen that 91% of acid was converted to benzyl acetate if [EMIM] [HSO 4 ] was used, 82% of acid was converted if [DEIM] [NTf 2 ] was used, 77% of acid was converted if [EMIM] [NTf 2 ] was used, 75% of acid was converted to benzyl acetate if [OMIM] [BF 4 ] was used, and 72% of acid was converted to benzyl acetate when [EMIM] [BF 4 ] was used. The comparative list of catalytic activity for the ILs was as follows: Table II The Experimental Design and Response Values for [EMIM] [HSO 4 ] Experiment number x 1 x 2 x 3 Conversion of acid (%) Y 1 1.0 0.25 6 77.96 2 1.0 0.50 4 85.59 3 1.0 0.50 8 85.30 4 1.0 0.75 6 91.00 5 1.5 0.25 4 63.50 6 1.5 0.25 8 71.44 7 1.5 0.50 6 80.40 8 1.5 0.50 6 79.96 9 1.5 0.50 6 79.13 10 1.5 0.50 6 79.27 11 1.5 0.50 6 79.44 12 1.5 0.75 4 83.96 13 1.5 0.75 8 87.54 14 2.0 0.25 6 42.82 15 2.0 0.50 4 68.58 16 2.0 0.50 8 76.94 17 2.0 0.75 6 77.92

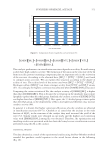
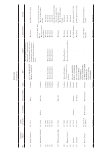
371 SYNTHESIS OF BENZYL ACETATE 4 4 2 2 4 EMIM BF OMIM BF EMIM NTf DEIM NTf EMIM HSO . The catalytic performance in esterification reactions depends on acidity. ILs with strong acidity have high catalytic activity. The formation of the anion in the structure of the IL from an acidic proton-containing component plays an important role in the activation of the reaction. According to the obtained data, [BF 4 ]¯ ˂ [NTf 2 ]¯ ˂ [HSO 4 ] was found to compare anion activities. We can explain this situation according to the degree of acidity of ions. The acidity levels of the anions used were [BF 4 ]¯ ˂ [NTf 2 ]¯ ˂ [HSO 4 ]¯. Hydrogen sulfate ([HSO 4 ]¯) ion shows stronger acidity than [NTf 2 ]¯ and [BF 4 ]¯ anions (67). Accordingly, the highest conversion was obtained when [EMIM] [HSO 4 ] was used. Comparing the cation activities of ILs, the catalytic activity of [OMIM] [BF 4 ] is higher than that of [EMIM] [BF 4 ]. This is because the octyl group in the imidazole ring is more lipophilic (apolar) than the ethyl group. Similarly, the catalytic activity of [DEIM] [NTf 2 ] was higher than that of [EMIM] [NTf 2 ]. Here again, the 1,3 diethyl group is more apolar than the ethyl group, so the dispersibility of ILs is also higher and therefore, may increase catalytic activity (68). In general, it is known that higher conversion efficiencies of acidic catalysts are obtained in esterification reactions (69–71). Chrobok et al. stated that the increase in the mole fraction of H 2 SO 4 in the structure of the catalyst they used increased the yield of the ester (72). Similar results were obtained in our study, and the highest acid conversion value with [EMIM] [HSO 4 ] among ILs was obtained. Therefore, the optimization and modeling results were presented with data from the benzyl acetate esterification reaction performed using this IL as the catalyst. STATISTICAL ANALYSIS The data obtained as a result of the experimental studies using the Box–Behnken method revealed the quadratic model equation in the actual factors shown in the following (Eq. 10): 0 10 20 30 40 50 60 70 80 90 100 [EMIM][BF4] [OMIM][BF4] [EMIM][NTf2] [DEIM][NTf2] [EMIM][HSO4] Type of ionic liquids Figure 6. Comparison of ionic liquids by acid conversion (%). Conversion of acid (%)
Purchased for the exclusive use of nofirst nolast (unknown)
From: SCC Media Library & Resource Center (library.scconline.org)