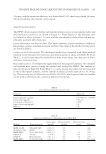
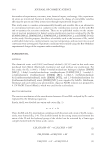
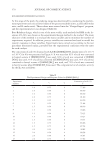
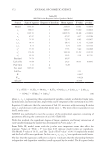
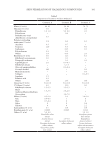
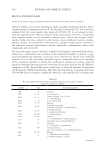
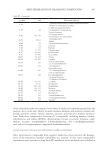
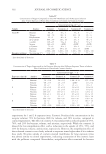
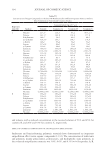
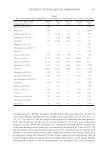
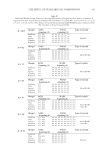
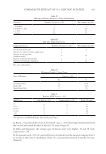
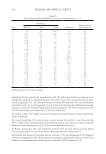
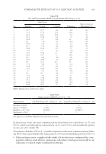
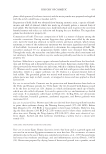
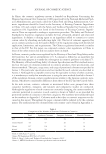
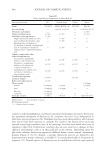
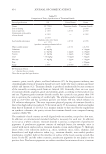
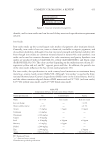
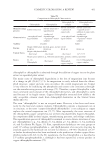
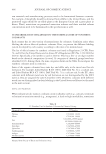
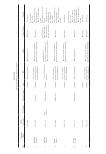
372 JOURNAL OF COSMETIC SCIENCE = - + + + + Y x x x 87.35 11.35x 94.41x – 8.27x 34.12x 2.16x – 2.18x – 11.94x – 87.66x 0.61x 1 2 3 1 2 1 3 2 3 1 2 2 2 3 2 (10) where x 1 , x 2 , x 3 representing three experimental variables, namely acid/alcohol molar ratio, IL molar ratio, and reaction time, respectively and Y (response) is the conversion of acid (%). Equation 10 indicates that the conversion of AA (%) increases with increasing IL molar ratio x 2 and decreases with acid/alcohol molar ratio x 1 . The most effective parameter was the IL molar ratio. ANOVA was performed to test the accuracy of the polynomial equation consisting of parameters affecting the conversion of acid (%) (Table III). With this method, the significant degree of linear, quadratic and binary interaction of each variable forming the model was determined by F-test and p F. From Table III, model terms with the p-value were important terms that affect the response. Values of “Prob F” less than 0.05 indicate model terms are significant. The Model F-value of 19.51, and The “Lack of Fit F-value” of 90.33 implied the model and the Lack of Fit was significant. In this case x 1 , x 2 , x 1 x 2 , x 2 2 are significant model terms. The fact that the regression coefficient is close to 1 indicates that the relationship between independent and dependent variables is well expressed by the model. The R-squared value Table III ANOVA for the Response Surface Quadratic Model Source Sum of squares Degrees of freedom Mean square F-value p-value Model 1926.26 9 214.03 19.51 0.0004 x 1 588.07 1 588.07 53.60 0.0002 x 2 1005.76 1 1005.76 91.68 0.0001 x 3 47.97 1 47.97 4.37 0.0748 x 1 x 2 72.76 1 72.76 6.63 0.0367 x 1 x 3 18.71 1 18.71 1.71 0.2329 x 2 x 3 4.75 1 4.75 0.43 0.5315 x 1 2 37.55 1 37.55 3.42 0.1068 x 2 2 126.39 1 126.39 11.52 0.0115 x 3 2 25.25 1 25.25 2.30 0.1730 Residual 76.79 7 10.97 Lack of fit 75.68 3 25.23 90.33 0.0004 Pure error 1.12 4 0.28 Cor. total 2003.06 16 Std Dev. 3.31 R2 0.9617 R2 adj 0.9124 Adeq R2 16.556

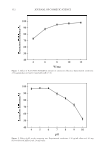
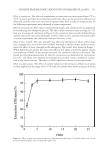
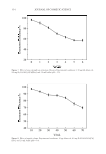
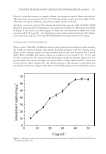
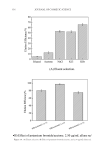
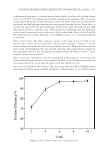
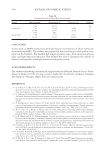
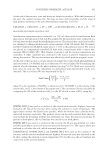
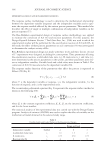
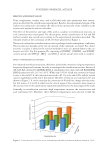
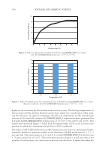
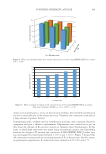
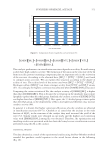
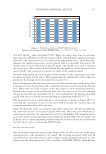
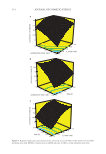
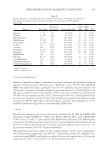
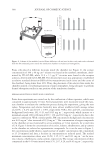
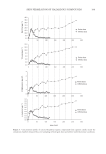
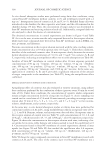
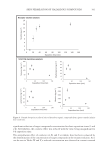
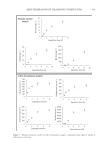
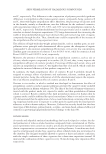
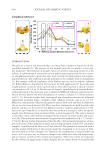
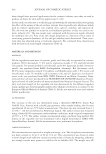
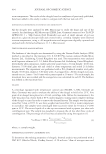
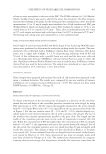
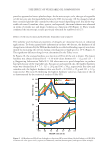
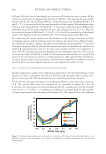
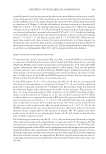
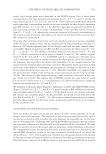
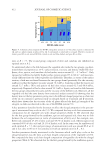
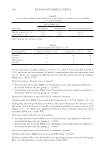
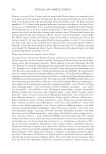
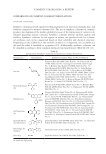
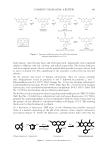
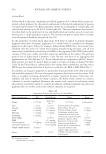
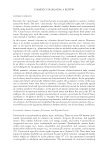
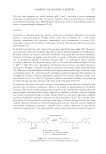
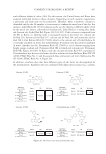
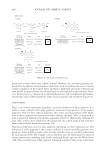
373 SYNTHESIS OF BENZYL ACETATE of 0.9617 and R2 adj value was found 0.9124. These two values were close to each other shows that the conversion of acid (%) estimated by the obtained model equation was quite adjacent to the conversion of acid (%) obtained by experimental data. “Adeq Precision” measures the signal-to-noise ratio. A ratio greater than 4 is desirable. The ratio of the model found as 16.556 indicated an adequate signal. This model can be used to navigate the design space. These statistical data showed that the quadratic model obtained can be used to predict acid conversion (%) within the range of the variables studied. The three dimensional and contour plots of the variables on the conversion of acid (%) are shown in Figure 8A, B, and C. These graphs show the mutual effect of the other two parameters by keeping one of the parameters constant (61). Figure 8A represents the interaction between acid/alcohol molar ratio and IL molar ratio. Conversion of acid (%) decreased with acid/alcohol mole ratio and increased with IL mole ratio. More than one of the reactants causes the balance to shift toward the products. However the increase in the acid/alcohol mole ratio, the excess acid (%) in the medium did not increase the acid conversion (%). It can be explained by the dilution of alcohol and IL with excess acid in the reaction medium, as in previous studies (63,67,73). The interaction between acid/alcohol mole ratio and time is shown in Figure 8B. It is clear that the conversion of acid (%) increased with increasing the reaction time and decreased with the acid/alcohol mole ratio. Figure 8C shows the interaction between time and IL molar ratio. The plot revealed that the conversion of acid (%) decreased slightly with time, and at the point where the IL mole ratio is maximum, the conversion of acid (%) is the highest. This might be due to active sites in the reaction medium increase with the amount of IL (74). As a result, the IL molar ratio is a more important parameter than the reaction time for the esterification reaction also it can be seen from the ANOVA table. RECYCLE AND REUSE OF IL One of the most important factors in the ability of ILs to reduce the cost of the ester- ification process is the possibility to be reused. The recycling and reuse of the used IL will both reduce the production cost and its impact on the environment because it is not thrown into the environment (62). The reusability of [EMIM] [HSO 4 ], which had the 0 10 20 30 40 50 60 70 80 90 100 1 cycle 2 cycle 3 cycle 4 cycle 5 cycle Figure 7. Performance of recycled [EMIM] [HSO 4 ] catalyst (Reaction Conditions:AA: BA: [EMIM] [HSO 4 ] = 1:1: 0.75, T = 110°C, t = 8 h). Conversion of acid (%)
Purchased for the exclusive use of nofirst nolast (unknown)
From: SCC Media Library & Resource Center (library.scconline.org)