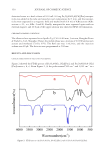
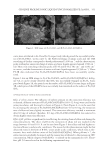
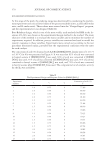
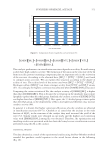
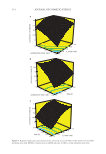
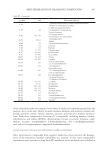
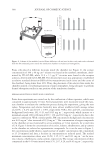
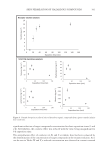
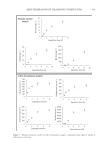
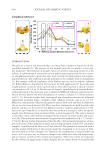
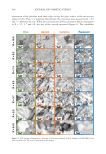
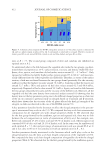
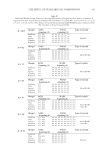
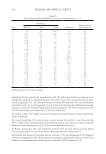
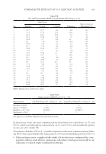
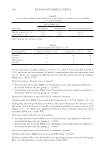
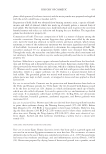
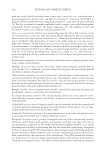
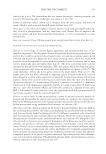
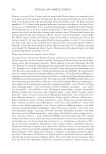
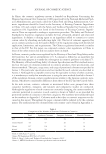
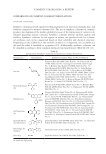
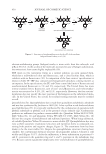
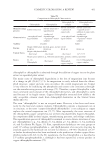
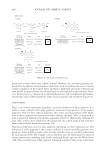
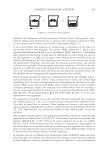
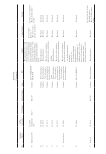
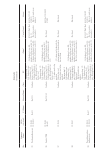
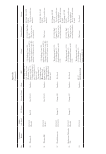
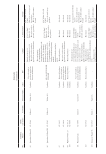
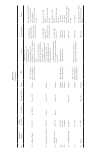
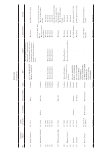
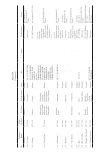
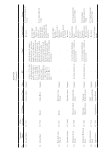
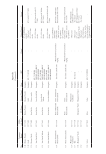
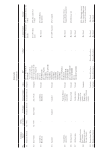
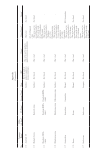
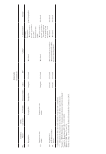
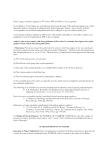
405 THE EFFECT OF VEGETABLE OIL COMPOSITION to keep an inert atmosphere in the oven of the DSC. The STARe software (v.15.00, Mettler- Toledo, Viroflay, France) was used to identify the onset, the maximum, the offset tempera- tures and the enthalpy of the peaks, for the melting and the crystallization curves. For all the measurements, 10 to 15 mg of sample were introduced in a 60-µL stainless steel DSC pan (Perkin Helmer) which was hermetically sealed. After loading the sample at 25°C, it was cooled down to 0°C at a speed of 25°C·min−1. Then, after an isothermal period of 15 min to 0°C, each sample was heated and cooled twice from 0 to 80°C at the speed of 5°C·min−1. The heating and cooling steps were separated by a 2-min isothermal step. SMALL-ANGLE AND WIDE-ANGLE X-RAY SCATTERING Small-Angle X-ray Scattering (SAXS) and Wide-Angle X-ray Scattering (WAXS) exper- iments were performed to determine the molecular packing inside the crystals. The mea- surements were performed with a SAXSpace (Anton Paar, Graz, AUustria. The X-ray source was a copper tube (CuKα1, λ = 1,54 Å) producing radiations with 40 kV and 50 mA. A line collimation with a parallel beam was used and the data were collected on a 2D image plate detector. SAXSDrive software (Anton Paar) was used to collect the data. OptiQuant software (Perkin-Helmer) was used to read the data. SAXStreat software (Anton Paar) was used for data reduction. The sample was introduced in a past cell her- metically sealed at 25°C (thickness: 1 mm, Anton Paar). STATISTICAL ANALYSIS Three oleogels were prepared and measured for each oil. All results were expressed as the mean ± standard deviation. The results were compared by one-way analysis of variance and Tukey’s test to analyze statistical differences (p 0.05). The analysis was done using PASW Statistics 18 (SPSS Inc., Chicago, IL. RESULTS MICROSTRUCTURE OF OLEOGELS AS A FUNCTION OF OILS To obtain information on the microstructure of oleogels as a function of oils, we deter- mined the size and shape of the crystalline particles contained in each oleogel by using DIC microscopy at 25°C. All the typical micrographs obtained for the seven oleogels from R = 10:0 (pure BO in oil) to R = 0:10 (pure BA in oil) are presented for all the oils in Figure 1. For the two extreme ratios (R = 10:0 and R = 0:10), platelet-shaped crys- talline particles were observed whatever the oil used to produce the oleogel. The face of the platelets was oriented spontaneously parallel to the glass slide. The length and the width of the crystalline particles were on the order of magnitude of around 100–300 µm. When the concentration of BO was higher than the concentration of BA, in oleogels with R = 8:2 and 7:3, the appearance and size of the crystals drastically changed. For all the oils tested, the crystalline particles were very small (less than 50 µm in length) with needle-like structures. This change of shape was first described by Blake et al. for plant wax crystals (41). It was confirmed later also on oleogels based on stearyl alcohol/stearic acid system by Blach et al. (20). Same observations was done on oleogels made with pure fatty alcohols by Valoppi et al. (26). The authors have demonstrated, by cryogenic scanning electron microscopy, that the presence of needle-like structures comes from the

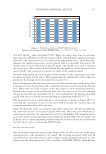
406 JOURNAL OF COSMETIC SCIENCE orientation of the platelets with their edges facing the glass surface of the microscopy slides (19,20). Thus, it is supposed that platelet-like structures were present for R = 8:2 and 7:3, whatever the oils. When the concentration of BA is increased, which corresponds to R = 5:5, 3:7 and 2:8, the size of the crystals increased (Figure 1). The crystalline Figure 1. DIC images of oleogels as a function of R between behenyl alcohol: behenic acid (BO:BA) in the four vegetable oils. The scale is indicated on the images.
Purchased for the exclusive use of nofirst nolast (unknown)
From: SCC Media Library & Resource Center (library.scconline.org)