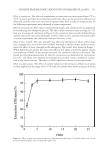
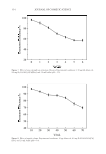
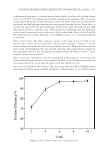
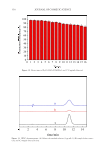
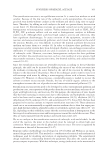
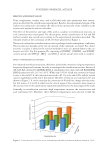
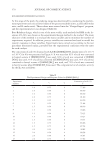
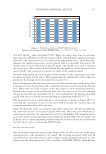
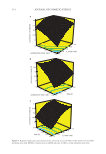
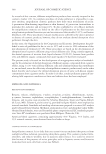
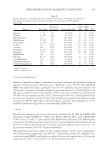
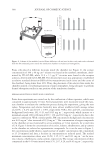
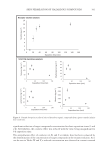
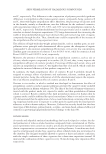
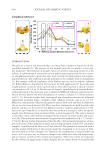
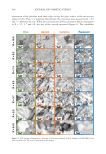
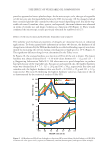
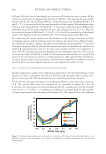
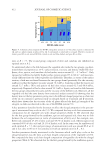
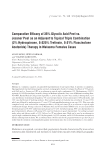
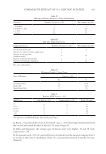
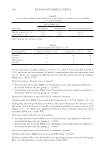
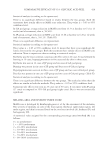
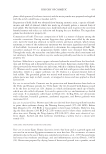
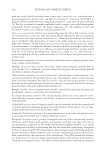
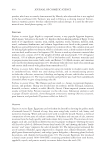
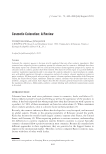
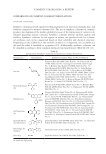
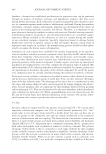
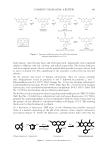
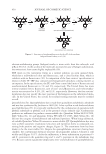
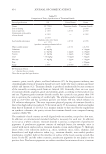
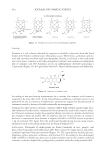
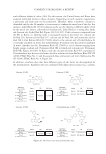
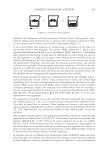
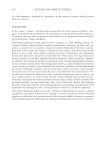
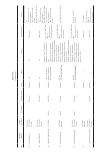
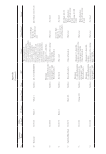
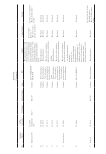
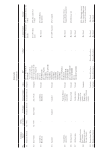
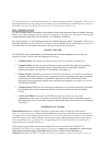
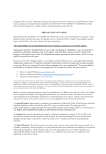
407 THE EFFECT OF VEGETABLE OIL COMPOSITION particles appeared to have a platelet shape. At the microscopic scale, the type of vegetable oil did not give any distinguishable features by DIC microscopy. All the oleogels studied here contained platelet-like crystals but their size varied depending on R. For all the veg- etable oils tested (camelina, olive, apricot, and rapeseed), the same behavior was observed in terms of crystals size and shape evolution as a function of R (Figure 1). These results confirmed the microscopic results previously obtained for sunflower oil (27). EFFECT OF THE OIL ON OLEOGEL PROPERTIES: HARDNESS AND STABILITY The stability and mechanical properties of oleogels are important factors in industrial applications. To obtain quantitative information on these two factors, the hardness of all oleogels was evaluated by the TPA method and the so-called oil-binding capacity was deter- mined by measuring the oil loss during centrifugation at high speed at 25°C (Figure 2). The significant different oleogels were determined by the Tukey’s test. In Figure 2A, the average hardness as a function of R for all the oils is shown. The lowest hardness was always obtained for R = 0:10 with values between 83 ± 12 g and 123 ± 5 g (Supporting Information Table SI.1). BA alone was not a good oleogelator to produce hard gels for any of the vegetable oils. For apricot and rapeseed oils, the highest hardness value was obtained for R = 7:3: 323 ± 28 g and 306 ± 38 g, respectively. For olive and camelina oils, the highest hardness value was for R = 8:2 (269 ± 25 g and 243 ± 32 g, respectively). The ratio R exhibiting the highest hardness varied as a function of the oil as demonstrated by the statistical analysis (Table SI.1) 50 100 150 200 250 300 350 Olive Apricot Camelina Rapeseed 0 2 4 6 8 10 12 BO:BA ratio (w:w) 10:0 8:2 5:5 3:7 2:8 0:10 7:3 A B Figure 2. (A) Hardness and (B) oil loss of oleogels as a function of R between behenyl alcohol:behenic acid (BO:BA) in various oils: olive (green circle), apricot (red diamond), camelina (brown square), and rapeseed (blue triangle). Hadnessg) %) Oloss

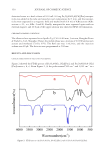
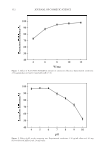
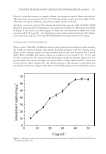
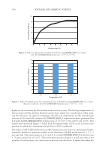
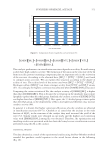
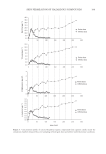
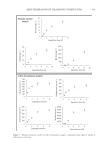
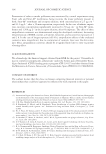
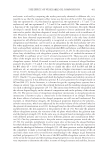
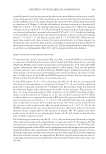
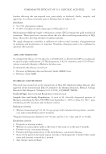
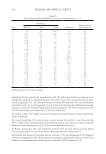
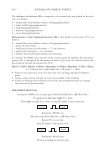
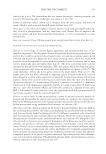
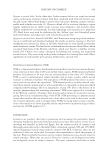
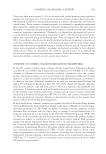
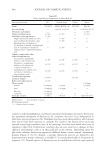
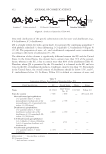
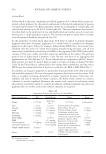
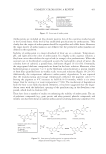
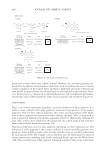
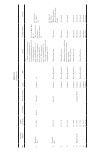
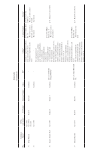
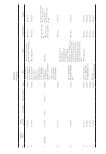
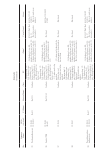
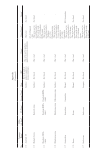
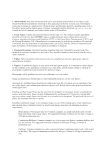
408 JOURNAL OF COSMETIC SCIENCE In Figure 2B, the oil loss of the oleogels as a function of R for the four oils is shown. All the values are presented in the Supporting Information Table SI.2. We observed the same global trend for all oils. The oil loss for pure BO (R = 10:0) was around 4%. By adding BA (R = 8:2 and R = 7:3), a decrease in the oil loss was observed for all the samples. The minimum values of oil loss were obtained for R = 8:2 and for R = 7:3 for apricot and rapeseed oils. Whereas the minimum values for the same parameter for olive and camelina oil were R = 8:2. Then, by increasing the amount of BA from R = 5:5 to R = 0:10, the oil loss increased for all the oleogel systems. The highest oil loss was reached for R = 0:10 corresponding to pure BA in oil. By combining the results obtained for the hardness of the oleogels and their so-called oil-binding capacity and by applying statistical analysis, we observed two different behav- iors (Table SI.1 and SI.2). Apricot and rapeseed oils exhibited an optimal R at 7:3 in terms of oleogels properties such as observed in our previous study for sunflower oil, whereas the optimal R appeared for the ratio 8:2 for olive and camelina oils (27). It is important to notice that the maximal values for the hardness and the minimum values for oil loss varied as a function of the oil (Table SI.1 and SI.2). This observation showed that for a given R the nature of the oil also had an impact on oleogel properties. We supposed that the polarity, viscosity, density, surface tension, presence of polar minor components in different amount as well as fatty acid chain length composition could explain this result (34–39). EFFECT OF THE OIL ON THE THERMAL BEHAVIOR OF THE OLEOGELS Another important parameter for industrial applications is the thermal behavior of the oleogels. In order to determine the effect of the oils on the thermal behavior of the oleo- gels as a function of R, DSC measurements were performed for all the oleogels. For all the oils, the same melting and crystallization behaviors were observed as function of R. The typical DSC curves for camelina oil are presented in Figure SI.1. For all R and oils, one major peak was observed during both the crystallization and the melting, except for R = 3:7 and R = 2:8 showing an additional secondary peak on their profiles at lower temperatures than the main peak (Figure SI.1). We supposed that two different 48 50 52 54 56 58 60 62 64 BO:BA ratio (w:w) Olive Apricot Camelina Rapeseed 10:0 8:2 5:5 3:7 2:8 0:10 7:3 Figure 3. Main melting temperature of oleogels as a function of R between behenyl alcohol:behenic acid (BO:BA) in various oils: olive (green circle), apricot (red diamond), camelina (brown square), and rapeseed (blue triangle). Peakmetng empeaue(C)
Purchased for the exclusive use of nofirst nolast (unknown)
From: SCC Media Library & Resource Center (library.scconline.org)