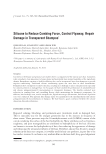
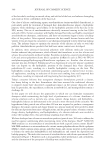
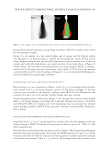
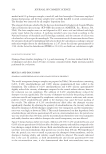
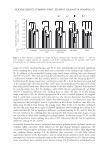
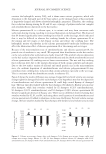
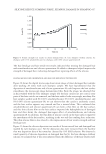
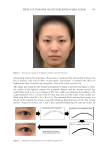
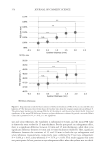
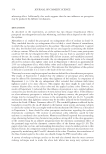
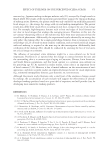
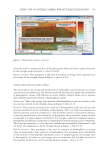
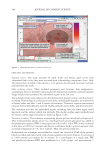
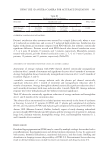
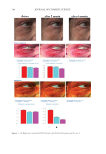
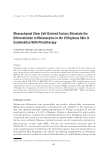
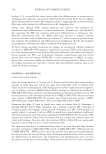
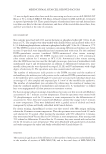
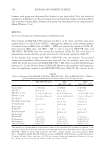
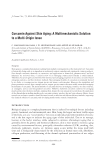
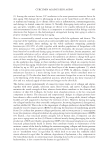
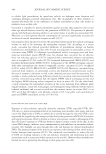
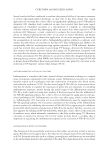
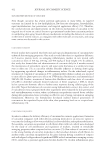
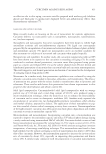
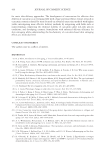
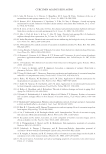
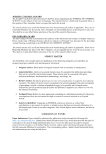
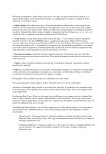
365 EFFECT OF EYELINER ON THE PERCEIVED SCLERA COLOR relationship with eyeliner thickness. Experiment 2 evaluated the relationship between the hue of eyeliner color and its effect on perception. Experiment 3 evaluated the effects of lightness and hue of eyeliner on perception, color of the sclera, and eye size. The image processing for the thickness-modulated stimuli is presented in Figure 2. First, the outline of the applied eyeliner was manually defined, and the average vertical line width from head to tail was computed. The line width was modulated according to the target thickness (0.5 to 2.0 mm with 0.5 mm step size), and the inside of the outline was filled with black color (R =G =B =0.1). The obtained black eyeliner layer image was placed on the original face image using alpha blending (blending ratio of 0.9). The colored eyeliner images for stimuli sets 2 and 3 were generated following the same procedure by Figure 1. Average face image of 40 Japanese females aged 20–26 years. Figure 2. Image processing steps for virtual eyeliner application.

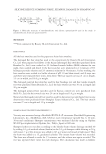
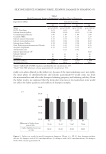
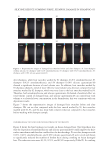
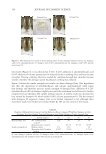
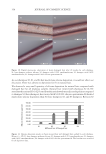
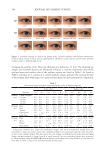
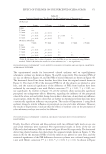
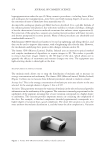
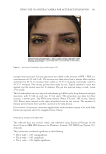
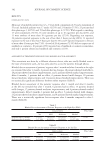
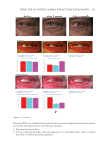
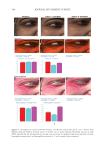
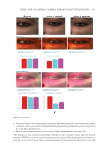
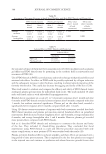
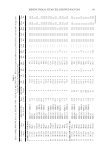
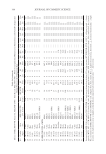
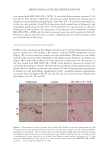
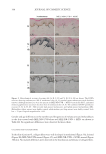
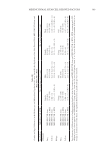
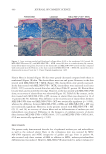
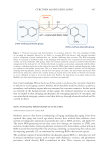
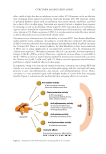
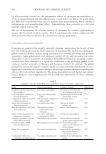
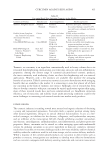
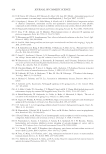
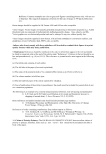
366 JOURNAL OF COSMETIC SCIENCE changing the eyeliner colors. Here, the thickness was defined as 1.5 mm. The trimmed eye images of all stimuli datasets are illustrated in Figure 3, and the colorimetric data of the eyeliner layers and surface color of the eyeliner regions are listed in Table I. As listed in Table I, stimulus set 2 consists of 4 colored eyeliner images generated by varying the hue of the eyeliner layer with respect to a grey eyeliner image of equal intensity for comparison. Figure 3. Standard stimulus set used in the present study: (1) black eyeliners with thickness modulation (2) hue-rotated colored eyeliners and an equal-lightness achromatic eyeliner (grey) and (3) brown and blue eyeliners with two different light levels. Table I Colorimetric Data of Eyeliner Layers and Surface Color of Eyeliner Regionsa Layer color Surface color Eyeliner L* a* b* C* h L* a* b* C* h Stimuli set 1 0 mm (original) 28.1 12.3 15.0 19.4 50.5 0.5 mm 9.0 0.0 0.0 0.0 45.0 12.7 4.0 4.1 5.8 45.7 1.0 mm 9.0 0.0 0.0 0.0 45.0 12.4 2.4 2.7 3.6 47.7 1.5 mm 9.0 0.0 0.0 0.0 45.0 12.6 1.8 2.1 2.8 49.7 2.0 mm 9.0 0.0 0.0 0.0 45.0 12.7 1.5 1.9 2.4 51.0 Stimuli set 2 Grey 20.0 0.0 0.0 0.0 145.1 21.0 2.2 2.6 3.4 50.0 Red 20.0 20.0 0.0 20.0 0.0 21.0 18.2 2.9 18.5 9.0 Yellow 20.0 0.0 20.0 20.0 90.0 21.2 2.3 19.0 19.1 83.1 Light green 20.2 −18.7 0.3 18.7 179.1 20.9 −17.1 1.3 17.2 175.5 Light blue 20.0 0.0 −20.0 20.0 270.0 20.5 −0.1 −14.0 14.0 269.8 Stimuli set 3 Blue 12.3 18.0 −31.6 36.4 299.6 14.4 14.5 −23.9 28.0 301.2 Navy 17.4 12.1 12.5 17.3 45.9 19.1 12.2 12.8 17.6 46.4 Brown 10.7 9.0 −15.8 18.2 172.3 13.2 7.8 −12.1 14.4 302.9 Dark brown 13.2 6.0 6.2 8.7 45.4 15.8 7.2 7.7 10.5 46.8 a Comparison stimulus sets, sclera-color–modulated images, and eye-size–modulated images were also generated by image processing. Sclera-color–modulated images were generated using the same procedure as that for the eyeliner images. The direction of the color change was defined based on the measured aging change and was assumed to change linearly at equal intervals. Eye-size–modulated images were generated by image warping using the MATLAB function imwarp (in the Image Processing Toolbox) to vary their size from 90% to 110% in steps of 1%, both horizontally and vertically.
Purchased for the exclusive use of nofirst nolast (unknown)
From: SCC Media Library & Resource Center (library.scconline.org)