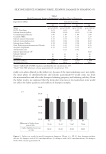
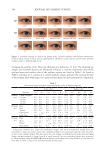
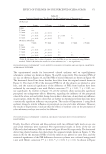
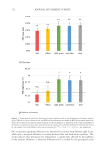
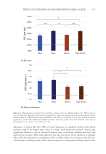
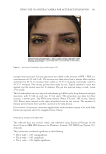
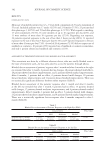
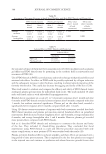
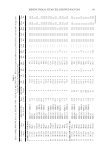
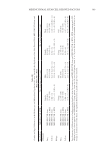
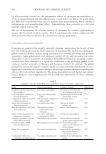
396 JOURNAL OF COSMETIC SCIENCE between each group was determined by Student’s t-test (two-tailed). Also, the statistical significance of differences in the percentages of restored skin with melanocytes/melanoblasts and of restored elastin fibers between each group was determined by the nonparametric Mann–Whitney U test. RESULTS INDUCTION OF MELANOCYTE/MELANOBLAST DIFFERENTIATION Total sessions of MEL/NB-UVB exposures reached 1 to 83 times, and their total doses ranged from 0.2 to 204.9 J/cm2 (Table I). Although the difference in the average number of sessions between MEL alone and MEL +MTK was statistically significant (Table II), those between MEL alone and MEL +MT as well as between NB-UVB alone and NB-UVB +MT/MTK were not statistically significant (Table II). The total doses of phototherapy among the three groups were also not statistically significant (Table II). In the lesional skin treated with MEL +NB-UVB, only one (patient 14) successful melanocyte/melanoblast differentiation was observed, but the numbers were very low (Table IA). In the skin treated with MEL/NB-UVB +MT, three successful differentiations (patients 22, 27, and 28) were observed (Table IB). However, their numbers and frequencies were not significant compared with MEL/NB-UVB alone (Table II). By contrast, in the Table II Effects of Treatment With MEL/NB-UVB Alone, MEL/NB-UVB +MT, and MEL/NB-UVB +MTK on Epidermal Melanocytes/Melanoblasts and Elastin Fibers in the Vitiliginous Skin MEL/NB-UVB alone MEL/ NB-UVB +MT MEL/ NB-UVB +MTK Patient (F:M) 17 (F6:M11) 17 (F8:M9) 17 (F9:M8) Age (Ave) 38.3 ± 5.6 38.3 ± 5.6 36.9 ± 5.5 MEL (No. of sess) 15.7 ± 3.3a (N =17) 8.5 ± 2.0 (N =13) 7.2 ± 2.3b (N =13) NB (No. of sess) 18.1 ± 6.1 (N =13) 11.3 ± 2.8 (N =12) 7.1 ± 1.1 (N =11) Dose (J/cm2) 28.3 ± 9.1 9.4 ± 3.0 16.5 ± 11.5 MT, MTK (Treated days) 0 48.3 ± 10.2 39.9 ± 10.1 M (Nonlesional) 102.3 ± 7.8 112.2 ± 8.1 109.9 ± 6.3 M (Lesional) 0 0 0 M (Treated) 0.1 ± 0.1c 1.8 ± 1.1d 25.9 ± 8.4e Mb (Nonlesional) 104.6 ± 2.5 100.8 ± 1.9 108.0 ± 2.5 Mb (Lesional) 0 0 0 Mb (Treated) 0.3 ± 0.3f 3.7 ± 2.5g 27.5 ± 8.2h M (Frequency) 5.9% (1/17)i 17.6% (3/17)j 58.8% (10/17)k Mb (Freqency) 5.9% (1/17)l 17.6% (3/17)m 58.8%(10/17)n Elastin (Treated) 0% (0/17)o 82.4% (14/17)p 100% (17/17)q The melanocyte and melanoblast populations/0.1 mm2 in the interfollicular epidermis in addition to the recovery of elastin fibers after the treatment with MEL/NB-UVB alone, MEL/NB-UVB +MT, and MEL/ NB-UVB +MTK are shown. MT, treatment with FFC, collagen peptide, and elastin peptide MTK, MT +UCB-MSCCS MEL NB, NB-UVB sess, sessions of MEL/NB-UVB M, melanocyte Mb, melanoblast F, female M, male Dose, total dose of UVB Ave, average. Statistically significant differences, j-k, m-n (P 0.05) a-b, c-e, d-e, f-h, g-h, i-k, l-n (P 0.01) o-p, o-q (P 0.001).

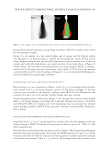
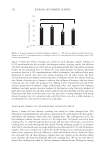
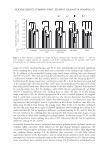
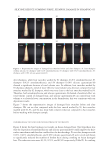
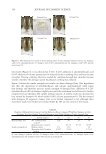
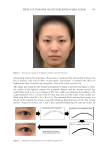
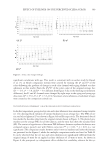
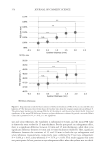
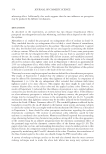
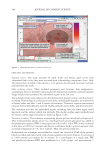
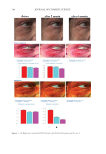
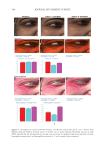
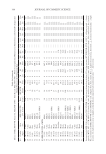
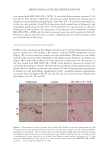
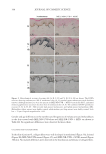
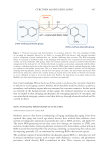
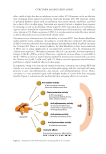
397 MESENCHYMAL STEM CELL-DERIVED FACTORS skin treated with MEL/NB-UVB +MTK, 10 successful differentiations (patients 41–44 and 46–51) were observed (Table IC). Our previous study showed that normal sizes of melanocyte and melanoblast populations/0.1 mm2 were 100–120 and 100, respectively (11). In the two cases (patients 44 and 51) of the present study, normal sizes of melanocyte and melanoblast populations/0.1 mm2 (105.7, 107.6 and 98.9, 97.5, respectively) were observed. Differences in the numbers and frequencies of melanocytes and melanoblasts between MEL/NB-UVB +MTK and the other two groups were statistically significant (Table II). However, it appears that there was no distinct repigmentation after these treatments from our visual analysis of the lesions. MELANOCYTE AND MELANOBLAST POPULATIONS DOPA reaction of nonlesional skin (Figure 1A) of patient 41 revealed numerous tyrosinase- positive melanocytes with dendrites. By contrast, combined DOPA–premelanin reaction (Figure 1D) revealed numerous melanocytes and melanoblasts. Melanocytes were darkly stained by this reaction, while melanoblasts were lightly stained. However, no melanocytes (Figure 1B) or melanoblasts (Figure 1E) were observed in the lesional skin. By contrast, in the skin treated with MEL/NB-UVB +MTK, many dendritic melanocytes (Figure 1C) and melanoblasts (Figure 1F) were observed, whereas epidermal melanin pigmentation was hardly observed. However, in the two cases (patients 44 and 51) that possessed normal sizes of melanocyte and melanoblast populations/0.1 mm2, epidermal melanin pigmentation was clearly observed (Figures 2B, 2D, 2F, and 2H), but it was less than that of nonlesional skin (Figures 2A, 2C, 2E, and 2G). Figure 1. Histochemical sections of patient 41 are shown. The DOPA reaction detecting melanocytes (M) of nonlesional skin (A) revealed numerous melanocytes (arrows) with dendrites, and the combined DOPA– premelanin reaction (D, M +Mb) revealed melanocytes and melanoblasts (Mb). Melanoblasts (D, short arrows) were lightly stained, while melanocytes (D, long arrows) were darkly stained. By contrast, no melanocytes (B) or melanoblasts (E) were observed in the lesional skin. However, many dendritic melanocytes (C, F, long arrows) and melanoblasts (F, short arrows) were observed in the skin treated with MEL/NB-UVB +MTK. Scale bar =25 µm. Original magnification ×400.
Purchased for the exclusive use of nofirst nolast (unknown)
From: SCC Media Library & Resource Center (library.scconline.org)