258 JOURNAL OF COSMETIC SCIENCE
and agitation type (i.e., mixing, homogenization). Key composition factors were also
scrutinized: impact of gel viscosity by increasing the doses of a suitable rheology modifier
emulsifier level ratio between the internal aqueous phase and the external oily phase and
nature of the oil. This work also aimed to find an appropriate test to check quickly that the
formulation is optimized without waiting for the conventional stability tests. With this in
mind, flow and oscillatory rheology experiments were explored to test the structure and
resistance of gel-in-oils.
MATERIALS AND METHODS
INGREDIENTS AND COMPOSITION OF THE FORMULATION BASE
Formulation experiments were carried out by changing one parameter at a time. A formula
base with a reduced number of ingredients was chosen to facilitate analysis of the impact
of changes (Table I).
Ingredients were weighed using an ML 1602 precision balance (Mettler Toledo GmbH,
Greifensee, Switzerland) to prepare 300 g of each formulation.
CHARACTERIZATION AND STABILITY OF FORMULATIONS
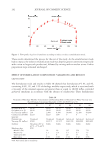
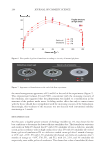
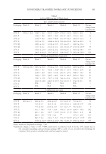
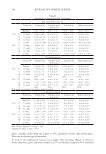
Viscosity measurement. The viscosity of the samples was measured using a Brookfield
LVDVI+™ viscometer using an appropriate spindle and speed 6 (Brookfield Engineering
Laboratories Inc., Middleboro, MA, USA). Measurements were taken one day after
manufacturing (D1), after 7 days (D7), after 1 month (M1), and after 3 months (M3).
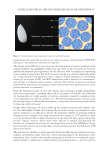
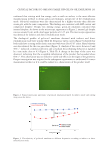
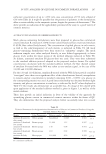
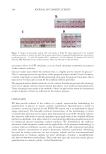
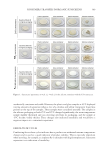
Microscopic observations. The stable formulations were observed using an optical microscope
Meiji® MT-9300 (Meiji Techno Co., Ltd., Saitama, Japan) with a magnification of ×400,
one week after manufacturing (D7), and images were captured by an attached charge-
coupled device camera GR500W (Shanghai Goldroom Im/Export Trade Co., Ltd.,
Shanghai, China).
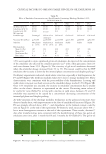
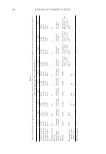
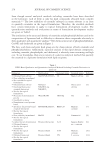
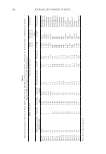
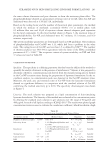
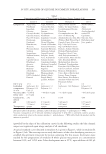
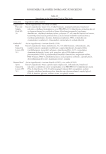
Table I
Formulation Base With Fixed Ingredients and Variables Studied
Phase Ingredient %(w/w)
Gel Demineralized water Up to 100
phase Hydroxyethyl acrylate/sodium acryloyldimethyl taurate copolymera 0.6/0.7/0.8/1/1.2
Xylitylglucoside and anhydroxylitol and xylitolb 3.00
Phenoxyethanol and ethylhexylglycerinc 0.80
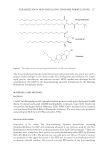
Oily Octyldodecanol and octyldodecyl xyloside and PEG-30
dipolyhydroxystearated
0.50/1/1.5/2/2.5/3
phase Caprylic/capric triglyceridee 3/5/8/13/18/23/28
a Polyelectrolyte rheology modifier (Seppic, La Garenne Colombes, France).
b Moisturizing active ingredient playing here the role of antifreeze agent (Seppic, La Garenne Colombes,
France): fixed ingredient in all the trials.
c Preservative (Thor Specialty Chemical Co., Ltd., Zhenjiang, China): fixed ingredient in all the trials.
d Liquid emulsifying system (Seppic, La Garenne Colombes, France).
e Oil (Croda International Plc, Goole, United Kingdom).
and agitation type (i.e., mixing, homogenization). Key composition factors were also
scrutinized: impact of gel viscosity by increasing the doses of a suitable rheology modifier
emulsifier level ratio between the internal aqueous phase and the external oily phase and
nature of the oil. This work also aimed to find an appropriate test to check quickly that the
formulation is optimized without waiting for the conventional stability tests. With this in
mind, flow and oscillatory rheology experiments were explored to test the structure and
resistance of gel-in-oils.
MATERIALS AND METHODS
INGREDIENTS AND COMPOSITION OF THE FORMULATION BASE
Formulation experiments were carried out by changing one parameter at a time. A formula
base with a reduced number of ingredients was chosen to facilitate analysis of the impact
of changes (Table I).
Ingredients were weighed using an ML 1602 precision balance (Mettler Toledo GmbH,
Greifensee, Switzerland) to prepare 300 g of each formulation.
CHARACTERIZATION AND STABILITY OF FORMULATIONS
Viscosity measurement. The viscosity of the samples was measured using a Brookfield
LVDVI+™ viscometer using an appropriate spindle and speed 6 (Brookfield Engineering
Laboratories Inc., Middleboro, MA, USA). Measurements were taken one day after
manufacturing (D1), after 7 days (D7), after 1 month (M1), and after 3 months (M3).
Microscopic observations. The stable formulations were observed using an optical microscope
Meiji® MT-9300 (Meiji Techno Co., Ltd., Saitama, Japan) with a magnification of ×400,
one week after manufacturing (D7), and images were captured by an attached charge-
coupled device camera GR500W (Shanghai Goldroom Im/Export Trade Co., Ltd.,
Shanghai, China).
Table I
Formulation Base With Fixed Ingredients and Variables Studied
Phase Ingredient %(w/w)
Gel Demineralized water Up to 100
phase Hydroxyethyl acrylate/sodium acryloyldimethyl taurate copolymera 0.6/0.7/0.8/1/1.2
Xylitylglucoside and anhydroxylitol and xylitolb 3.00
Phenoxyethanol and ethylhexylglycerinc 0.80
Oily Octyldodecanol and octyldodecyl xyloside and PEG-30
dipolyhydroxystearated
0.50/1/1.5/2/2.5/3
phase Caprylic/capric triglyceridee 3/5/8/13/18/23/28
a Polyelectrolyte rheology modifier (Seppic, La Garenne Colombes, France).
b Moisturizing active ingredient playing here the role of antifreeze agent (Seppic, La Garenne Colombes,
France): fixed ingredient in all the trials.
c Preservative (Thor Specialty Chemical Co., Ltd., Zhenjiang, China): fixed ingredient in all the trials.
d Liquid emulsifying system (Seppic, La Garenne Colombes, France).
e Oil (Croda International Plc, Goole, United Kingdom).