284 JOURNAL OF COSMETIC SCIENCE
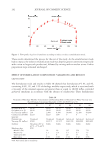
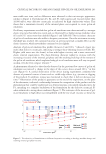
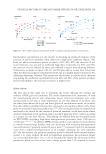
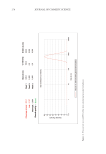
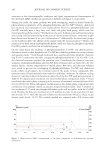
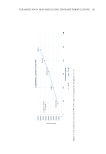
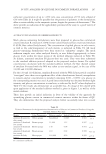
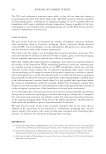
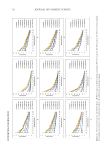
probability of correlation between peak area and concentration. The correlation coefficient
of the calibration curve was more than 0.99, which met the validation requirements for this
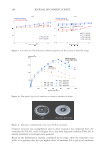
parameter.16 The linear regression of calibration curves produced the equations presented in
Figure 5, where y was the peak area and x was the analyte concentration in μg/mL.
The slope of the calibration curve was different from zero according to student’s t-test as
recommended, and its high value (1691.8) indicated an appropriate response of the method
against changes in the concentrations. The calculation of residues resulted in random
data distribution with no tendency. The proportional test calculated following student’s
t-test showed that the independent terms (−16933) could be attributed to the acceptable
systematic error of the method. Overall, based on these results HPLC method is indicated
to be linear and to provide all requirements of international protocols for pharmaceutical
analytical methods.
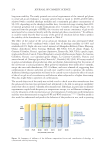
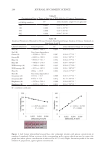
LOD and LOQ. The LOD value of Cer-NP was 7.90 µg/mL. The LOQ value was 24.06 µg/
mL. These values were sufficient to quantify Cer-NP in the skin-simulating liposome
formulation assays such as encapsulation efficiency, in vitro performance tests, etc.
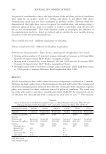
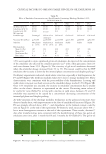
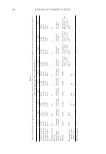
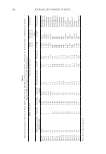
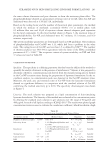
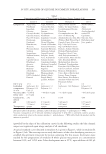
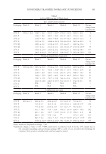
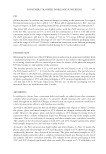
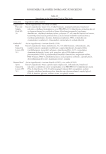
Precision. The precision of the method was facilitated to assess variability because of
random errors which cannot be controlled as those related to reagents glassware and sample
preparation. The precision results (intra- and inter-day) are presented in Table IV. Cer-NP
exhibited acceptable results (from 0.99% to 4.41%) in accordance with the literature25,26 for
intra- and inter-day analysis.
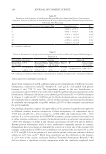
Accuracy. The accuracy of an analytical procedure expresses the closeness of agreement
between the value that is accepted either as a conventional true value or an accepted
reference value and the value found.16 The mean recovery could be within 90% to 110%
of the theoretical value for non-regulated products.27 The accuracy results of the three
analytes ranged from 97.03% to 110.21% (Table IV). Herein, it indicated that there was a
proximity between experimental and theoretical concentration values of the analytes.
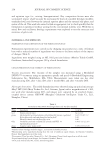
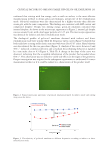
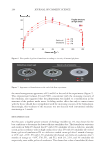
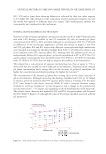
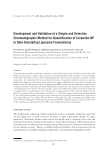
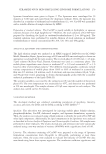
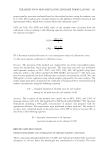
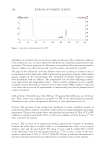
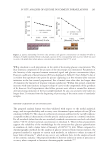
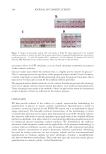
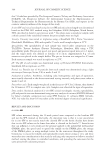
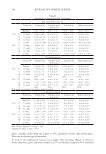
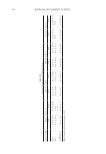
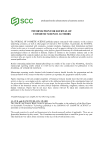
Figure 4. Specificity chromatogram of Cer-NP.
probability of correlation between peak area and concentration. The correlation coefficient
of the calibration curve was more than 0.99, which met the validation requirements for this
parameter.16 The linear regression of calibration curves produced the equations presented in
Figure 5, where y was the peak area and x was the analyte concentration in μg/mL.
The slope of the calibration curve was different from zero according to student’s t-test as
recommended, and its high value (1691.8) indicated an appropriate response of the method
against changes in the concentrations. The calculation of residues resulted in random
data distribution with no tendency. The proportional test calculated following student’s
t-test showed that the independent terms (−16933) could be attributed to the acceptable
systematic error of the method. Overall, based on these results HPLC method is indicated
to be linear and to provide all requirements of international protocols for pharmaceutical
analytical methods.
LOD and LOQ. The LOD value of Cer-NP was 7.90 µg/mL. The LOQ value was 24.06 µg/
mL. These values were sufficient to quantify Cer-NP in the skin-simulating liposome
formulation assays such as encapsulation efficiency, in vitro performance tests, etc.
Precision. The precision of the method was facilitated to assess variability because of
random errors which cannot be controlled as those related to reagents glassware and sample
preparation. The precision results (intra- and inter-day) are presented in Table IV. Cer-NP
exhibited acceptable results (from 0.99% to 4.41%) in accordance with the literature25,26 for
intra- and inter-day analysis.
Accuracy. The accuracy of an analytical procedure expresses the closeness of agreement
between the value that is accepted either as a conventional true value or an accepted
reference value and the value found.16 The mean recovery could be within 90% to 110%
of the theoretical value for non-regulated products.27 The accuracy results of the three
analytes ranged from 97.03% to 110.21% (Table IV). Herein, it indicated that there was a
proximity between experimental and theoretical concentration values of the analytes.
Figure 4. Specificity chromatogram of Cer-NP.