296 JOURNAL OF COSMETIC SCIENCE
APPLICABILITY IN DIFFERENT MATRICES
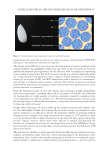
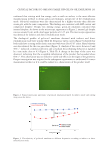
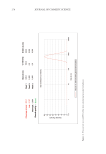
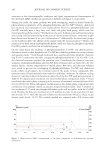
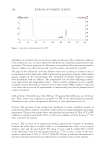
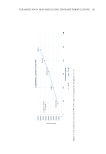
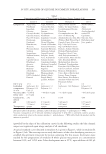
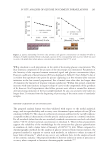
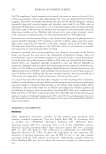
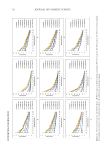
Apart from emulsions A and B, additional glucose-free formulations of different viscosity,
transparency, conductivity and pH, “shampoo A,” and “gel A,” were spiked with glucose
between 0 and 7*10−3% w/w. The ingredients present in the two formulations at
concentrations above 0.001% w/w can be seen in Table I, together with certain properties of the
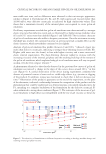
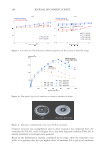
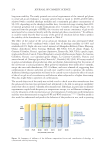
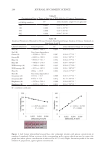
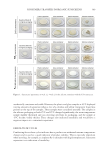
formulations. Obtained calibration curves showed good linearity (R2 =0.994 for shampoo
A, (Figure 2, right) and R2 =0.989 for gel A). Back-calculated glucose concentrations in
the standards were acceptable (within ±14.1% of their nominal concentration for shampoo
A standards) and marginally acceptable (within ±41.0% of their nominal concentration)
for gel A standards.
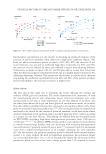
Our findings altogether, support the applicability of the proposed quantification approach
in different cosmetic matrices irrespective of their transparency, oil composition (up to
27.9% w/w oil), pH (5.4 – 6.8), viscosity (3 – 1,000k mPa), and conductivity (2.92 – 14.56
mS/cm). It is to be noted that the GOD/POD enzymatic system remains functional even
at rather extreme conditions in cosmetic formulations (such as a surfactant concentration of
∼20% w/w (shampoo A, Table I) and ethanol concentration of 62% w/w (gel A, Table I).
Known protein denaturants (such as urea, surfactants) commonly present in cosmetic
formulations have been shown to diminish the activity of at least one of the enzymes: For
example, rather mediocre GOD activity inhibition was reported (by less than 10% to 25%
at 25°C and pH 6.4) in the presence of urea and the anionic surfactant sodium n-dodecyl
sulfate (at ≤2% w/w, each).20 Much more significant was the inhibition in the presence
at ≤2% w/w of the cationic surfactant Dodecyl Trimethyl Ammonium Bromide.20 We
did not observe a significant activity compromise under the conditions employed (total
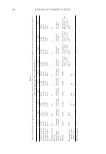
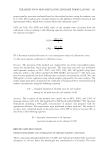
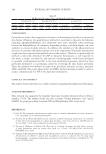
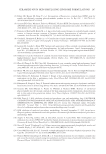
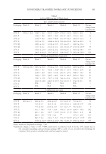
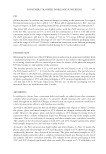
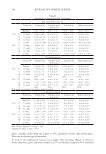
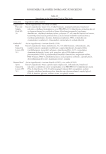
Table V
Technical Parameters for the Quantitative Determination of Glucose With the Proposed Methodology in
Emulsion A
Intermediate precision Accuracy Linearity
Mean [Glu],
10−3% w/w
CV %Measured [Glu],
10−3% w/w
Spiked [Glu],
10−3% w/w
Bias %R2 Linear range,
10−3% w/w
1.52 11.56 (n =3) 1.52 (n =3) 1.37 +11.06
≥0.991 (n =3) 0.00 – 6.37
4.75 1.68 (n =3) 4.75 (n =3) 4.55 +4.37
CV: coefficient of variation [Glu]: Glucose concentration n: number of replicates R2: correlation coefficient.
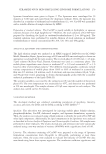
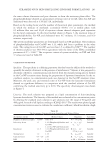
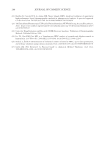
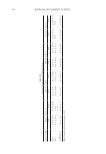
Table IV
Parameters of the Linearity of the Response Between Measured Signal and Glucose Concentration
(Equation, Pearson’s Coefficient of Determination (R2)) Upon Monitoring Blue Channel Output Alteration
with Time After Processing
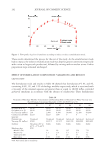
Time After Initiation of Processing of Last Sample (Min) Linear Equation R2
5 –8206 × +185.1 0.997
9 –9581 × +180.4 0.981
13 –10121 × +180.3 0.976
21 –10665 × +179.8 0.977
26 –10834 × +182.4 0.962
60 –10529 × +170.8 0.945
R2: correlation coefficient.
APPLICABILITY IN DIFFERENT MATRICES
Apart from emulsions A and B, additional glucose-free formulations of different viscosity,
transparency, conductivity and pH, “shampoo A,” and “gel A,” were spiked with glucose
between 0 and 7*10−3% w/w. The ingredients present in the two formulations at
concentrations above 0.001% w/w can be seen in Table I, together with certain properties of the
formulations. Obtained calibration curves showed good linearity (R2 =0.994 for shampoo
A, (Figure 2, right) and R2 =0.989 for gel A). Back-calculated glucose concentrations in
the standards were acceptable (within ±14.1% of their nominal concentration for shampoo
A standards) and marginally acceptable (within ±41.0% of their nominal concentration)
for gel A standards.
Our findings altogether, support the applicability of the proposed quantification approach
in different cosmetic matrices irrespective of their transparency, oil composition (up to
27.9% w/w oil), pH (5.4 – 6.8), viscosity (3 – 1,000k mPa), and conductivity (2.92 – 14.56
mS/cm). It is to be noted that the GOD/POD enzymatic system remains functional even
at rather extreme conditions in cosmetic formulations (such as a surfactant concentration of
∼20% w/w (shampoo A, Table I) and ethanol concentration of 62% w/w (gel A, Table I).
Known protein denaturants (such as urea, surfactants) commonly present in cosmetic
formulations have been shown to diminish the activity of at least one of the enzymes: For
example, rather mediocre GOD activity inhibition was reported (by less than 10% to 25%
at 25°C and pH 6.4) in the presence of urea and the anionic surfactant sodium n-dodecyl
sulfate (at ≤2% w/w, each).20 Much more significant was the inhibition in the presence
at ≤2% w/w of the cationic surfactant Dodecyl Trimethyl Ammonium Bromide.20 We
did not observe a significant activity compromise under the conditions employed (total
Table V
Technical Parameters for the Quantitative Determination of Glucose With the Proposed Methodology in
Emulsion A
Intermediate precision Accuracy Linearity
Mean [Glu],
10−3% w/w
CV %Measured [Glu],
10−3% w/w
Spiked [Glu],
10−3% w/w
Bias %R2 Linear range,
10−3% w/w
1.52 11.56 (n =3) 1.52 (n =3) 1.37 +11.06
≥0.991 (n =3) 0.00 – 6.37
4.75 1.68 (n =3) 4.75 (n =3) 4.55 +4.37
CV: coefficient of variation [Glu]: Glucose concentration n: number of replicates R2: correlation coefficient.
Table IV
Parameters of the Linearity of the Response Between Measured Signal and Glucose Concentration
(Equation, Pearson’s Coefficient of Determination (R2)) Upon Monitoring Blue Channel Output Alteration
with Time After Processing
Time After Initiation of Processing of Last Sample (Min) Linear Equation R2
5 –8206 × +185.1 0.997
9 –9581 × +180.4 0.981
13 –10121 × +180.3 0.976
21 –10665 × +179.8 0.977
26 –10834 × +182.4 0.962
60 –10529 × +170.8 0.945
R2: correlation coefficient.