304 JOURNAL OF COSMETIC SCIENCE
this.14 Guidelines provided by The European Cosmetic Toiletry and Perfumery Association
(COLIPA), UL Prospector website, the International Council for Harmonisation of
Technical Requirements for Pharmaceuticals for Human Use (ICH), and experts in the
cosmetic industry influenced the design of this study.
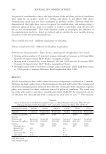
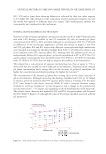
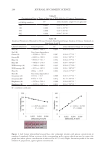
In vitro SPF and critical wavelength testing. In vitro SPF and critical wavelength were determined
based on the FDA 2011 method using the Labsphere 2000S (Labsphere, North Sutton,
NH), described in detail in our previous work.15 Two plates were scanned per sample, with
a third scanned if the variability between the prior samples were too high.
Viscosity. Viscosity was tested in triplicates using a Brookfield DV-1 Prime Viscometer
(Brookfield, Middleboro, MA) with spindle 27 and a small sample adapter at 25°C.
Spreadability. The spreadability of each sample was tested under compression on the
TA.XTPlus Texture Analyzer (Texture Technologies, Hamilton, MA) using a TTC
spreadability probe. The pre-test speed, test speed, and post-test speed were set to 3 mm/s,
and the target mode was defined as distance of 1 1 m m. Approximately 8 g of each
sunscreen was placed in the sample holder. The pre-set location was assigned at 6.5 mm.
Each sunscreen sample was tested in triplicates at 25°C.
pH. The pH of each sample was determined using a pH meter (HANNA Instruments,
Smithfield, RI) in triplicates at 25°C.
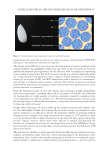
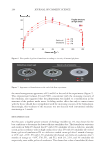
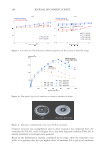
Particle size. Particle size of 30 particles from each sample was determined using a light
microscope (Amscope, Irvine, CA) at weeks 0 and 12.
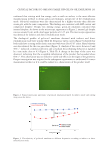
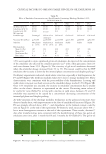
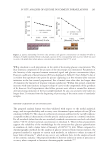
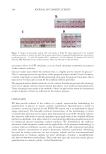
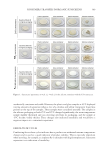
Evaluation of aesthetics. Aesthetics, including color, homogeneity, and signs of separation,
were visually observed at the above-mentioned testing intervals, and photos were taken at
weeks 0 and 12.
Freeze-thaw cycles. Each sample was placed in the freezer at -18°C for 24 hours, then thawed
for 24 hours at 25°C to complete one cycle. Samples were observed for signs of separation.
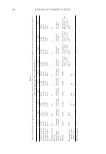
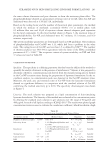
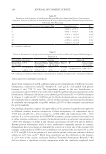
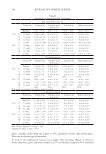
Data analysis. Statistical analysis of in vitro SPF, critical wavelength, viscosity, spreadability,
pH, and particle size were determined using one-way analysis of variance (ANOVA) followed
by Tukey’s multiple comparison test using SPSS Statistics 21 software (IBM, Armonk,
NY). A p value less than 0.05 was taken as the minimal degree of statistical significance.
RESULTS AND DISCUSSION
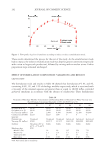
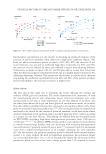
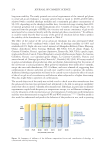
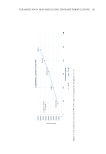
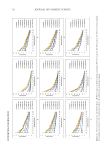
IN VITRO SPF
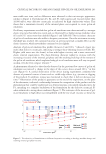
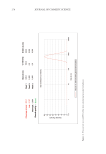
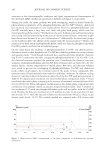
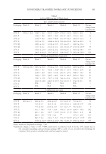
SPF values measured during the 12-week period were compared to the baseline SPF
and not the SPF claimed on the bottle. An important note is that it is not uncommon
for in vitro SPF to not exactly match the claimed SPF on the bottle. Studies have shown
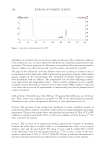
that in vitro SPF values can be lower than what is claimed on the bottle.16,17 Some factors
that can influence in vitro results are the pressure applied to the polymethyl methacrylate
(PMMA) plate, the speed used to spread the sample on the PMMA plate, the storage
of the PMMA plates, or using multiple testers for the sunscreens throughout the study.
Consistency is crucial for reliable and reproducible results when testing in vitro, and these
were taken into consideration in this study by utilizing only one person to follow a standard
method, storing the plates in controlled conditions, and spreading the sunscreens for the
same period with consistent pressure.
this.14 Guidelines provided by The European Cosmetic Toiletry and Perfumery Association
(COLIPA), UL Prospector website, the International Council for Harmonisation of
Technical Requirements for Pharmaceuticals for Human Use (ICH), and experts in the
cosmetic industry influenced the design of this study.
In vitro SPF and critical wavelength testing. In vitro SPF and critical wavelength were determined
based on the FDA 2011 method using the Labsphere 2000S (Labsphere, North Sutton,
NH), described in detail in our previous work.15 Two plates were scanned per sample, with
a third scanned if the variability between the prior samples were too high.
Viscosity. Viscosity was tested in triplicates using a Brookfield DV-1 Prime Viscometer
(Brookfield, Middleboro, MA) with spindle 27 and a small sample adapter at 25°C.
Spreadability. The spreadability of each sample was tested under compression on the
TA.XTPlus Texture Analyzer (Texture Technologies, Hamilton, MA) using a TTC
spreadability probe. The pre-test speed, test speed, and post-test speed were set to 3 mm/s,
and the target mode was defined as distance of 1 1 m m. Approximately 8 g of each
sunscreen was placed in the sample holder. The pre-set location was assigned at 6.5 mm.
Each sunscreen sample was tested in triplicates at 25°C.
pH. The pH of each sample was determined using a pH meter (HANNA Instruments,
Smithfield, RI) in triplicates at 25°C.
Particle size. Particle size of 30 particles from each sample was determined using a light
microscope (Amscope, Irvine, CA) at weeks 0 and 12.
Evaluation of aesthetics. Aesthetics, including color, homogeneity, and signs of separation,
were visually observed at the above-mentioned testing intervals, and photos were taken at
weeks 0 and 12.
Freeze-thaw cycles. Each sample was placed in the freezer at -18°C for 24 hours, then thawed
for 24 hours at 25°C to complete one cycle. Samples were observed for signs of separation.
Data analysis. Statistical analysis of in vitro SPF, critical wavelength, viscosity, spreadability,
pH, and particle size were determined using one-way analysis of variance (ANOVA) followed
by Tukey’s multiple comparison test using SPSS Statistics 21 software (IBM, Armonk,
NY). A p value less than 0.05 was taken as the minimal degree of statistical significance.
RESULTS AND DISCUSSION
IN VITRO SPF
SPF values measured during the 12-week period were compared to the baseline SPF
and not the SPF claimed on the bottle. An important note is that it is not uncommon
for in vitro SPF to not exactly match the claimed SPF on the bottle. Studies have shown
that in vitro SPF values can be lower than what is claimed on the bottle.16,17 Some factors
that can influence in vitro results are the pressure applied to the polymethyl methacrylate
(PMMA) plate, the speed used to spread the sample on the PMMA plate, the storage
of the PMMA plates, or using multiple testers for the sunscreens throughout the study.
Consistency is crucial for reliable and reproducible results when testing in vitro, and these
were taken into consideration in this study by utilizing only one person to follow a standard
method, storing the plates in controlled conditions, and spreading the sunscreens for the
same period with consistent pressure.