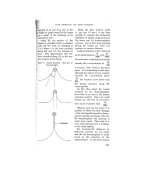
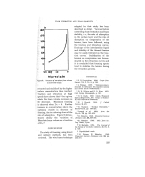
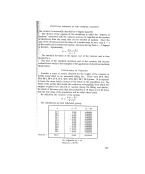
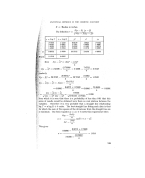
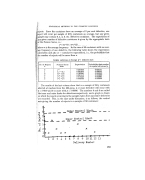
STATISTICAL METHODS IN THE COSMETIC INDUSTRY the coding involves a multiplication factor (in this case 10), the ce must be divided by the square of that factor to give the variance original data, thus' 54'568 • --• -- 0.54568 100 ß v•ith the value found directly. The mean of the coded results 213 -- 17-75 12 itch must be divided by the multiplier (10.) and 35'0 added to the result the mean of the original data, i.e., 17.75 -- q-35.0---- 36.775 10 Standard Deviation is the SCluar e root of the variance, in the above being •/0.54568 = 0'7386, or 0.74 useful purposes. This relates to any individual result. The standard of fhe mean of the series of results is given by the formula 0-74 Thus our a,• ¾'12 0-21 •:71:. If the distribution of the results is such that there are a i•aximum number •iii!about the mean, tailing off on either side of it,' then in practice the distribution !}!i}an be assumed to be normal (or Gaussian), for which tables have been con- !?'Structed showing how often a variation (d) from the mean expressed in terms iii(•øf the standard deviation of the mean can be expected to occur as a matter (•?of chance. This relation d/, is termed Student's t, and tables of this value ?are quoted in most standard works on statistics. !ii.ii!11i.:: In this example, it is desired to know the limits of the true mean of the ?i population at a probability level p := 0,05. :!!:.: Reference to a table of Student's t (see above) shows that for the example ::':With 11 degrees of freedom, at p -- 0-05, t is 2.20. i?., d d !11!:: Now, by definition, t - , thus 2.20 -- ?:?• er,• 0'21 :½:'/' d 2'20 X 0'21 = 0'462, which is the deviation either side of the mean '• with}n which the probability is 19 that the true mean of the population lies. -- 2O 237

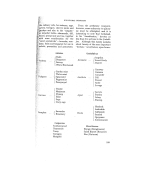
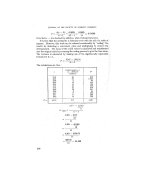
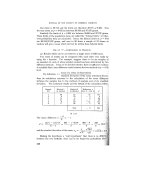
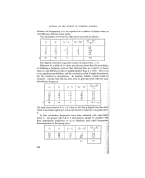
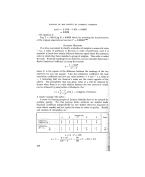
JOURNAL OF THE SOCIETY OF COSMETIC CHEMISTS Our mean is 36-775 and the limits are therefore 36.775 q- 0'462' thus the true mean at p ---- 0.05 lies between 36.313 and 37.237 grams. ' Similarly the limits of p = 0.001 are between 35.843 and 37.707 grams. These limits of the population mean are called the "fiducial limits" at what- -ever probability they are calculated ß hence, the fiducial limits at p = 0-05 are 86.313/37-237 grams, and once in 20 times a sample of 12 drawn at random will give a mean which will not lie within these fiducial limits. US.E OF "t"--COMPARISON' OF RESULTS (a) Results which can be converted to a single series of differences. Two series of results can be compared with each other very easily by using the t function. For example, suppose there to be six samples of an essential oil, each of whose alcohol content has been determined by two different methods. It has to be decided whether there is sufficient evidence to establish that a true difference exists between the two methods at p -- 0.05 level. .:: mean of a series of observations By definition, t •- ß standard deviation of the mean (Standard Error)il •' thus its calculation amounts to the calculation of the mean difference? ,. between the samples due to the method of analysis and of its stan•Iar d deviation. The analytical results and the details of the calculation follow• :" Sample Method 1 Method 2 Difference, x, No. __øz Alcohol • Alcohol (Col. 2--Col. 3) x • /o _ I 26 15 ll 121 2 8 10 -- 2 4 3 14 6 8 64 4 24 31 -- 7 49 5 8 19 -- 11 121 6 17 22 -- 5 25 Sum -- 6 384 N=6 --6 The mean difference- -- -- 1 6 a'= Z'(x') -- ( Zx)*/N _ 384 -- (--6)'/6 -- N--1 5 and the standard deviation of the mean, a m -- 384 -- 6 378 ..... 75.6 5 5 :.• -- %/12.3 -- Making the. hypothesis a "null hypothesis" that there is no between the two methods, there has to be found the probability 238
Purchased for the exclusive use of nofirst nolast (unknown)
From: SCC Media Library & Resource Center (library.scconline.org)