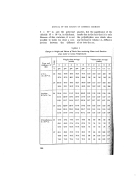
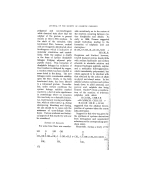
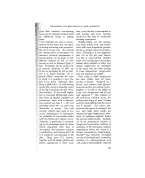
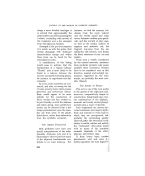
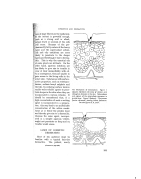
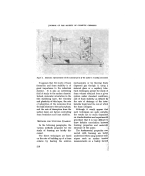
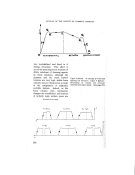
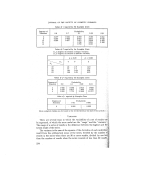
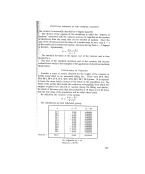
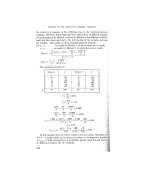
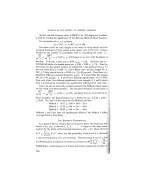
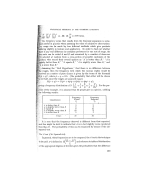
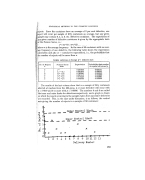
STATISTICAL METHODS IN THE COSMETIC INDUSTRY efts.' Since the containers have an average of 2 per cent defective, one ect will occur per sample of fifty containers on average, but any given may contain O, 1, 2, 3, etc. defective containers. The expectation of given number of defective containers is given by the appropriate term the Potsson Series, i.e.: e'"', me'm/l!, m•e'"'/2!, . ..... m is the average frequency. In the case.of 50 containers with an aver- frequency of one defective, the following table shows the expectation •icalculation and also (1 -- cumulative expectation), i.e., the probability that number of rejects will be more than n. $arnl•les containing an Average of I Defective Each No. of Rejects Potsson Series Expectation Probability that number n term of rejects will exceed n 0 e-• 0.367879 0.632121 1 1 e -• [1 ! 0.367879 0.264242 2 1 • e -¾2 ! O' 183940 0.080302 3 l a e -•[3 / 0-061313 0'018989 4 1 • e -•/4 / 0'015328 0.003661 5 1 • e -•/5 ! 0.003056 0.000595 ß The results of the last column show that in'a sample of fifty containers :::.½•iiSelected at random from the 100 gross, 4 or more defective will occur with = 0.019 and 6 or more with p • 0-0006. The numbers 4 and 6 are called '?ithe inner and outer limits for defectives respectively, and a graph is drawn which the rejects occurring in the samples taken from successive deliveries '•:•:are recorded. This, in the case under discussion, is as follows, the vertical •: i :'aXis giving the number of rejects in a sample of 50 containers' •m, mm m mm •m• Outer, CGntr_o_o 1 Limit Inner Control Limit Delivery NtLmb e r 253

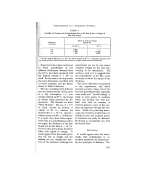
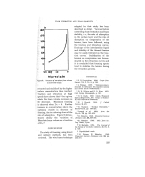
JOURNAL OF THE SOCIETY OF COSMETIC CHEMISTS Should a sample give sufficient rejects to lie outside the outer limits, a further sample of fifty should be examined and the result added to that of the first sample taken from the delivery. The complete sample examined now being made up of one hundred, would normally be expected to contain two rejects (2 per cent of 100). Calculation of the expectation of rejects for this size of sample places the outer limits now at 9 reject containers and the inner limits at 6 rejects. Should 9 or more rejects be found out of the hundred, the deliv.e. ry is rejected' should 7 or 8 rejects be found, a further sample is .taken and the results added to the previous ones and new limits found' should 5 or 6 rejects be found, the delivery would be accepted, but future deliveries watched carefully to see whether a deterioration in the average per cent defective has occurred. The customary levels of signiftcance for the inner limits of control charts are p --- 0.025 and for the outer limits p -• 0.001. If it is desired to put these levels exactly in the chart (there is no point as a container cannot be less than a unit), then the number of rejects is plotted on a graph against the.::: probability that it will' be exceeded, and then the exact value for the number of rejects at p = 0.025 and p--0.001 found by interpolation. In thiS: example these limits are 3.7 and 5.5 defective containers at p -- 0.025, and 5.6 and 8-8 at p --- 0.001, for samples of fifty and one hundred respectively.: FURTHER STUDY AND APP,I.I'•ATIONS .. No attempt has been made in this paper to do more than show application of statistical methods to a few typical examples which often.'! occur in the cosmetic industry. Anyone who troubles to study the technique•i:,' and their theoretical basis will find that they have acquired additionai:}i • "laboratory equipment" of similar h. tility to that of volumetric or chromi?i tographic methods. For practice, readers will find it instructive to examine any data from which they have drawn conclusions about whictf{ they have not been too confident, by making use of any analogous exampl•11!• given here. They will find the following texts appropriate for further stud•i•i and ,n, ot requiring an advanced mathematical background: Quality Control Charts," B. P. Dudding and W. J. Jennett, B.S. 6 1942. "Industrial Experimentation," K. A. Brownlee, H.M.S.O., 1949. "Facts from Figures," M. J. Moroney, a Pelican Book. "Statistical l•lethods," G. W. Snedecor, Iowa State College Press. "Rank Correlation Methods," •. G. Kendall, Charles Griffin & C Ltd. "Statistical Tables for Biological, Agricultural and Medical Research?•Jl R. A. Fisher and F. Yates. Oliver & Boyd, Ltd. A continuation of this article is planned, in which--among other thin gi 254
Purchased for the exclusive use of nofirst nolast (unknown)
From: SCC Media Library & Resource Center (library.scconline.org)