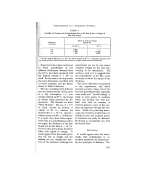
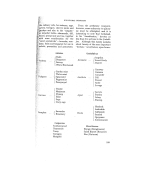
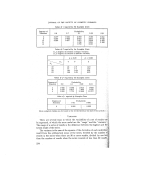
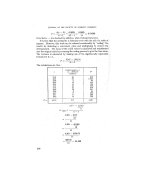
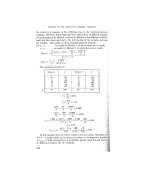
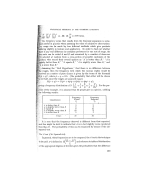
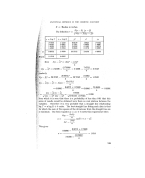
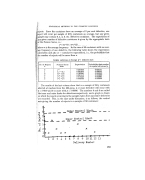
STATISTICAL METHODS IN THE COSMETIC INDUSTRY i.e., 36. 10. 6- • = 5.79 times. frequency series that results from the bim)mial expansion is some- useful in practice when assessing the value of subjective observations. rouge can be made by two different methods which give products slightly in texture and application. In order to find out whether is any real difference in consumer preference for one sort of rouge, the Sorts can be coded A and 23 and examined by a number of observers .'Selected at random from a cross-section of possible customers of the who record their overall opinion as "A is better than B," "A is ightly better than B," "A equals B," "A is slightly worse than B," and is worse than B." ?Assuming the "Null Hypothesis," that there is no difference between rouges, then the frequency with which the various replies would be ,,ived as a matter of pure chance is given by the terms of the binomial + q)', where p = q = 0.5. (The probability that either will be chosen since the rouges are assumed equal.) N(p q- q)* = N(p* q- 4p3q q- 6p•q • q- 4pq' q- (1 i a i ,) giving a frequency distribution of N •-• q- • q- • q- • q- • . For the pur- of the example, it is assumed that 32 people give an opinion, yielding following results: Classification A is better than B A is slightly better than A equals B A is slightly worse than A is worse than B Frequency Found fo Frequency Expected •e 3 6 8 10 5 2 8 12 8 2 Total: ' 32 32 It is seen that the frequency observed is different from that expected, •d•?:!i and this might be held to indicate that A is in fact slightly worse (preferred •/.•?':less) than B. The probability of this can be, examined by means of the chi- !•,ii!" squ area test. ?:,i'• In general, when frequencies are to be compared, the 7: test is the technique :./i•o be used. x•-is defined as • (fo -- f,)• andreferencetotablesofthisfunction ::: at the appropriate degrees of freedom gives the probability that the difference ß 245

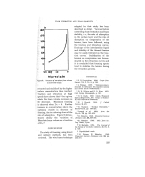
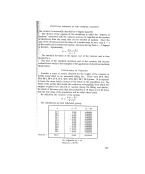
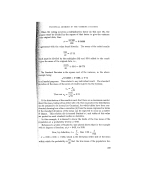
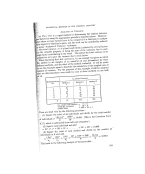
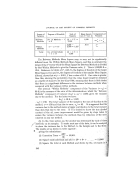
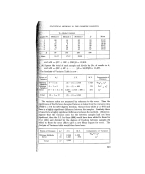
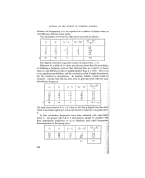
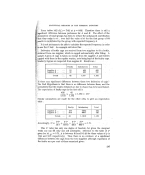
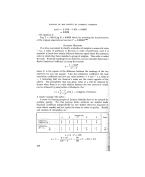
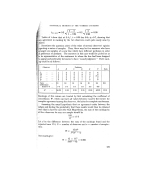
JOURNAL OF 'THE SOCIETY OF COSMETIC CHEMISTS between the frequencies is to be expected as a matter of chance when no real difference between them •xists. , v. The calculation of x• from the data above proceeds as follows ' 3 2 1 1 0.5 6 8 -- 2 4 '' 0.5 8 !2 , -- 4 16 1-33 10 8 . 2 4 0.5 5 2 3 9 4,5 32 32 0 7.33 ,. The degrees of freedom equal the number of classes less 1, -- 4. 'Reference to a table of X 3 values (see above) shows that the probability of obtaining a frequency such as that observed here as a matter of chance' when no real difference exists is slightly greater than p = 0-10. This is not a very significant probability, and the conclusion is that B might be preferred,: but the evidence is inconclusive. In practice, further results would be obtained. Assume that this has been done to give 64 results with the same distribution frequency. fe - I (io (fø - ,, 6 . 4 2 [ 4 1.0 12 16 -- 4 16 1.0 16 24 -- 8 64 2.7 20 16 4 16 1 '0 10 4 6 36 9.0 14'7 64 64 0 I , The table shows that at 4 d.f. a X 3 value of 14.7 has p slightly less than which is decidedly significant and shows that A. In this calculation frequencies have been obtained with expectati 'f? below 5. All groups with below 5 observations should be classified wit•:'ii their appropriate neighbours so as to eliminate such small frequencieS.!:i: Rearrangement of the group gives ß . , 18 20 -- 2 4 0.2 16 24 -- 8 64 2.7 30 20 lO 100 5-0 7.9 , 246
Purchased for the exclusive use of nofirst nolast (unknown)
From: SCC Media Library & Resource Center (library.scconline.org)