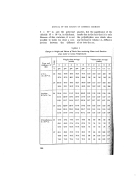
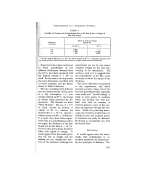
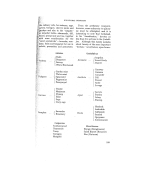
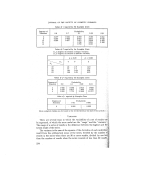
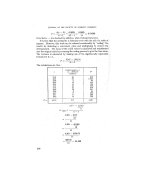
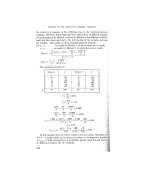
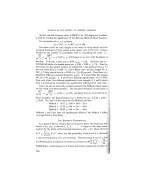
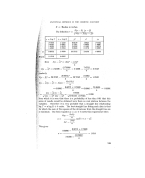
STATISTICAL METHODS IN THE COSMETIC-INDUSTRY •mPle No. Method 1 Method 2 Method 3 2 Mean •i!• 2• 15 s2 •3 31.00 ?71:. 2 8 lO 24 42 ,4.00 i :•/ 5•i? ' :, 3 14 6 35 -- 55 18-33 • [• (• •: 4 24 31 43 98 32.67 ?. '- ,7 .i '•5•:•::. ß • 97 103 236 436 •:• Mean 16.17 17-17 39.33 •?i-11:•:'and add = (97 • q- 103' q- 236')/6 = 12,619. Square the total of each sample and divide by No. of results in it, and add = (93' q- 42' q- ...... )/3-- 34,372/3---- 11,457. Analysis of Variance Table is now' i::!•i•rce of .' d.f. ' S.S. gI.S. Components of ? Variance Variance etween' 3 -- 1 = 2 .(3) -- (1) = 2,058 1,029 6a,, • _{_ 0'• 2 :Be•een 6 -- 1 = 5 (4) -- (1) • 896 179 3as • • %• •:.• •mples • : E•or 17- 2 - 5 = 10 3,285 - 2,058 - 896 = 33.1 ' %• • •o•l 18- I: 17 (2) --(1) : 3,285' The variance ratios are measured by reference to the error. Thus the of the Between Samples Variance is taken from the variance ratio .79/33'1 ----- 5'4 for 5/!0 degrees freedom, whence from tables p -- 0-0! and is a highly significant difference between the samples. Similarly there is found to be a highly significant difference between the methods. (However, that the variance ratio for the between samples had not been then the S.S. for these (896) would have been added to those for (331) and divided by the degrees of freedom between samples (5) to those for error (10) to give a new Mean.Square for error. The nalysis of Variance table would then have been :' Source of Variance d.f. S.S. M.S. Components of Variance Between Methods 2 2,058 1,029 6am' + a• Error 15 1,227 37.2 a• • Total I 17 3,285 _ ß I • 243

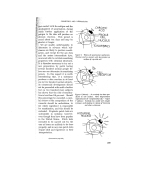
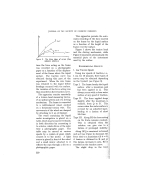
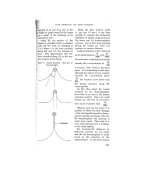
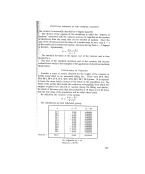
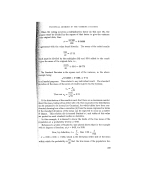
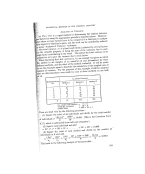
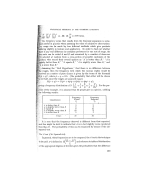
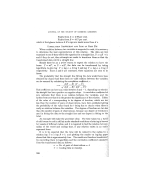
JOURNAL OF THE SOCIETY OF COSMETIC CHEMISTS (In this case the Variance ratio, 1,029/37.2 for 2/15 degrees of freedom, is used for testing the significance of the Between Methods Mean Squares.) - The calculation of (•fi, %L %2 gives ß aft • 33.1, (5 • = 48.7, cr,•' -- 166. The mean result for each sample is the mean'of three results and the standard deviation of those means is the square root of the error variance divided by the number of individuals used in calculating the mean, i.e., -- • •11.03 • • 3.32 based on an error with 10 de•ees of freedom. From the t table at p = 0.05, 1•0 aZ = 2-23. Therefore the p = 0.05 fiducial limits of a sample mean are & 2-23 x 3.32 = & 7-4. Thus the"' true mean for the alcohol content of Sample No. 1 lies between 31.0 • 7.4 per cent at the level 2 = 0-05•i.e., 24 to 38 per centsand for Sample No. 2, 14.0 • 7.4 per cent at level p = 0.05--i.e., 7 to 21 per cent. Thus there is a' significant difference between Samples 1 and 2. It is found that the samples fall into two groups' 1, 4 and 6 not differing significantly, at p = 0.05, from each other, but differing si•ificantly from Samples 2, 3 and 5 which•:•.: form a second group of samples not signiScantly differing from each There can also be found the variation between the Methods whose are the result of 6 determinations. The Standard deviation of each mean eft _ = •5.52 = • 2-35, calculated from an error with 10d.f.?• W6 •6 Thus, as before, the fiducial li•ts at p = 0.05 level, are • 2-23 x 2-35 • 5.24. The limits of the means for the Methods are then' .. Method 1 16-17 + 5-24 -- 10-9 -- 21.4 .• .•*• Method 2 17.70 + 5.24 ---- 12-5 -- 22-9. Method 3 39.33 •c 5.24 •- 34.1 -- 44-6 Methods 1 and 2 are thus nbt significantly different, but Method 3 very significantly from them. - THE BINOMIAL DISTRIBUTION In a game of dice in which n dice are tossed N times, the frequency which a six, say, is thrown 1, 2, 3 ....... n times in the same is given by the terms of the binomial expansion, N(p d- q)•, whose rth ,: ': •i•. • n ! p' q"", where p is the probability of the event (i.e., i is N • throw ng¾• a six) occurring and q of it not occurring. Thus throwing .5 dice at a t•me•:•c• 51 -- i.e. • for 36 times gives a frequency of 5 sixes at one throw of 36 5/ ' 65 0'004a times--and a frequency of 2 sixes and 3 other numbers at one throW' 244
Purchased for the exclusive use of nofirst nolast (unknown)
From: SCC Media Library & Resource Center (library.scconline.org)