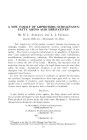
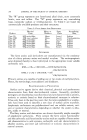
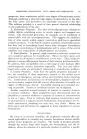
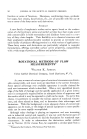
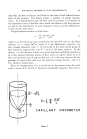
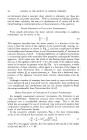
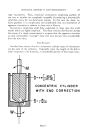
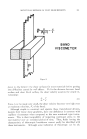
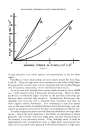
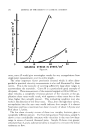
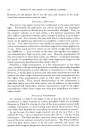
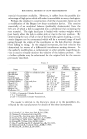
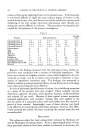
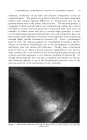
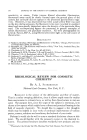
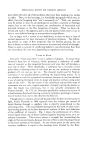
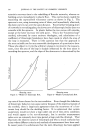
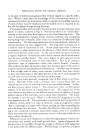
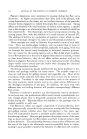
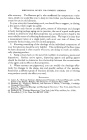
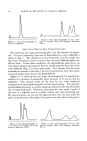
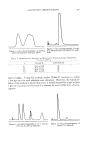
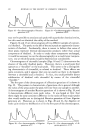
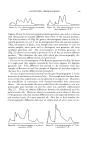
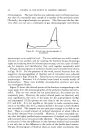
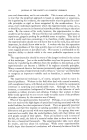
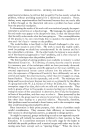
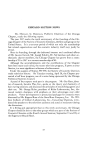
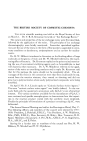
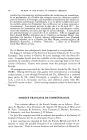
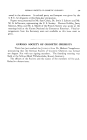
GAS-PARTITION CHROMATOGRAPHY 325 ran sometimes tell from the odor of a recovered fraction whether it is a de- tomposition product. If the fraction contains an olefin, occurrence of de- [tydration of an alcohol during the chromatography may be indicated. In- frared spectroscopy can be very helpful in this respect. For example, if two or three absorption peaks are present in the infrared spectrum of the •solate that are also present in the spectrum of the original mixture, it is at good indication that the isolate was present as such in the original mixture. Questions about differences in the structure and/or composition of rho- 12inol and citronellol have been puzzling essential oil and terpene chemists literally for decades. The two materials have markedly different odors, •vhich is the reason rhodinol costs eight or ten times as much as citronellol. Some investigators have ascribed the difference in odor solely to an isomeric Idifference between the major components citronellol possesses the isopro- Ipenyl structure, while the major component of rhodinol has been thought !by some to be an isomer of citronellol with an isopropylidene structure. lOther investigators have maintained that the difference in odor is due pri- •marily to desirable "impurities" or minor components of rhodinol that are mot present in citronellol. Some earlier work (without benefit of gas Ichromatography) had led us to agree with the latter explanation, but un- •equivocal evidence was still lacking. Figure 28 shows a chromatogram of one of the rhodinol samples obtained [for this work. This sample was unusual in that it did not give a sharp [peak but a rounded one as well as some unexpected peaks earlier in the [Figure 28.--Isolative gas chromatography of "abnormal" rhodinol. Figure 29.--Isolative gas chromatography of rhodinol I

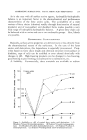
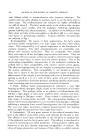
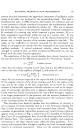
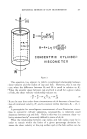
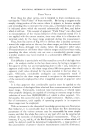
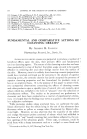
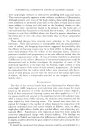
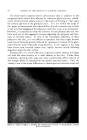
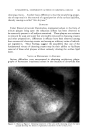
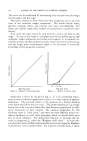
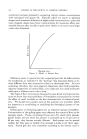
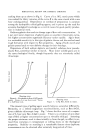
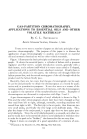
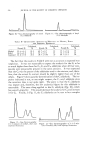
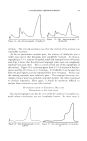
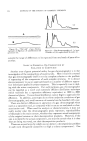
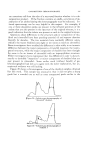
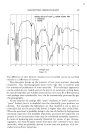
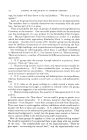
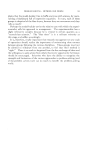
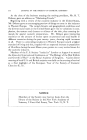
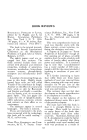
326 JOURNAL OF THE SOCIETY OF COSMETIC CHEMISTS chromatogram. The main fraction was collected, and its infrared spectrur• was that of a reasonably pure sample of a member of the menthone series Obviously, the original sample was spurious. This illustrates the fact thai very often one can use a ccrnbination of gas chromatography and infrare0 Figure 30.--Isolative gas chromatography of citronellol I. spectroscopy as an analytical tool. The two techniques are really comple-I mentary to one another, and by isolating the fractions by gas chromatog-I raphy and studying them by infrared spectroscopy, one has a pair of meth- ods for isolation and identification that work together remarkably well. The gas chromatograms of authentic rhodinol and citronellol were shown in Figs. 16-19. For the purposes of this work, several fractions from the respective chromatographies of rhodinol and of citronellol were collected as illustrated in Figs. 29 and 30. These fractions were examined by infrared spectroscopy. Fractions 1-4 of rhodinol were found to consist mostly of hydrocarbons. These were probably decomposition products and were: not investigated further. Figure 31 shows the infrared spectra of the fractions corresponding to the major peaks from the chromatographies of the authentic rhodinol and citro- nellol. They are very similar but not quite identical the isolates are not completely pure. However, the major infrared peaks are identical, and, most significantly, the ratios of the peaks for the isopropylidene (12.0/•) and isopropenyl (11.25u) groups are very close in the two curves that is, 0.57 and 0.49. It is not possible at this point to make conclusive state- ments to the effect that the C•0 terpene alcohol is the same in both rhodinol and citronellol. The samples are not quite pure enough to be able to say that. There is a small amount of carbonyl absorption at about 5.85/• in the alcohol obtained from citronellol. However, it seems reasonably cer- tain that the highly purified major components of rhodinol and citronellol will eventually prove to be practically identical. The important conclusion at this point is that the difference in odor between rhodinol and citronellol is not only due to the difference in the ratios of the double-bond isomers. The gas chromatogram of rhodinol shows so many other constituents that
Purchased for the exclusive use of nofirst nolast (unknown)
From: SCC Media Library & Resource Center (library.scconline.org)