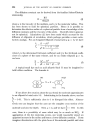
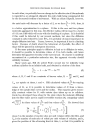
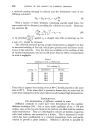
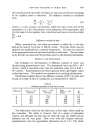
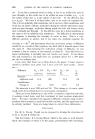
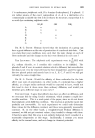
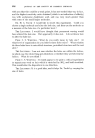
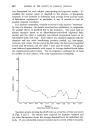
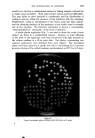
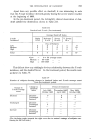
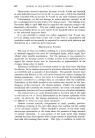
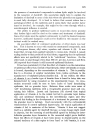
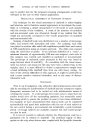
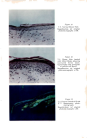
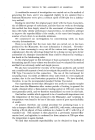
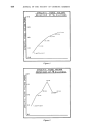
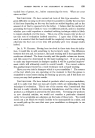
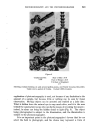
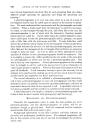
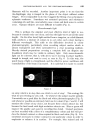
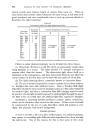
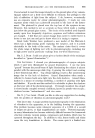
THE INVESTIGATION OF DANDRUFF 613 F4ey June July Auc/uif Sept Oct Nov Dec Jori Feb Morck April Figure 8 Individual dandruff graph (showing marked fluctuations). the dandruff index averaged each month over all subjects should have shown this. Data from the same 12-month period, for 12 members of the "anionic" panel and 8 members of the other panel is illustrated in Fig. 4. :z MONTH • Ethoxylated Soap Shampoo, 8 subjects O Anionic Shampoo, 12 subjects Figure 4 Dandruff index in study of seasonal variation.

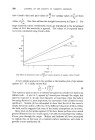
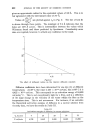
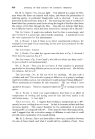
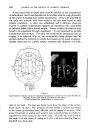
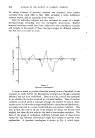
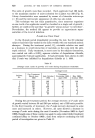
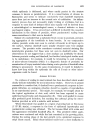
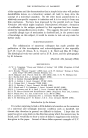
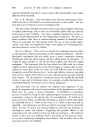
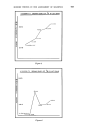
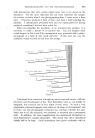
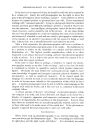
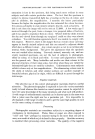
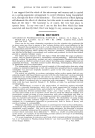
614 JOURNAL OF THE SOCIETY OF COSMETIC CHEMISTS No strong evidence of seasonal variation was obtained these studies extended from April 1962 to May 1963, including a rather indifferent summer season, and an unusually severe winter. Data for individual subjects was also examined by means of a simple moving-average extending over five fortnightly observations. Marked seasonal variations would have been reflected in the coincidence of peaks and troughs in the graphs of these moving-averages for different subjects but this was not found to occur. • L •G -I0 Figur• • Specimen correlogram. To learn as much as possible about the normal course of dandruff, it was necessary to study further the fluctuations recorded even though a seasonal influence had not been established. Data as in Figs. 2 and $ was examined to see whether fluctuation occurred in a random fashion. Thus, if random variation occurred about a constant average, the number of runs of obser- vations above or below the average would follow a characteristic distribution too many long runs in a series would indicate non-random variation. This was, in fact, the case in 15 out of 22 subjects for whom the records were studied, but these did not indicate the kind of non-random variation. The form of the graph of correlation coefficient between pairs of observations versus the 'lag' between observations might have helped to provide some explanation. A specimen correlogram is shown in Fig. $, which repre-
Purchased for the exclusive use of nofirst nolast (unknown)
From: SCC Media Library & Resource Center (library.scconline.org)