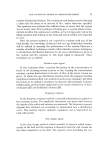
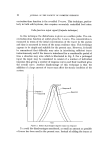
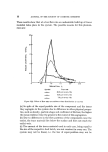
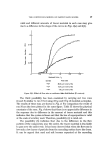
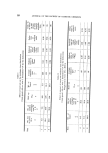
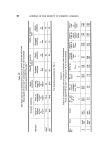
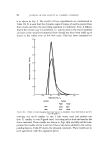
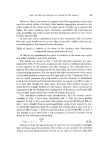
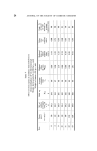
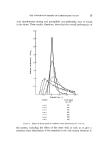
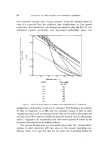
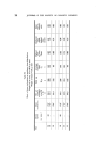
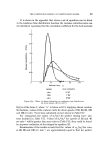
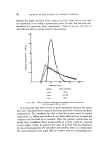
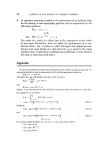
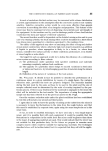
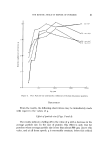
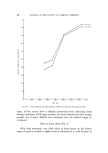
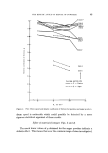
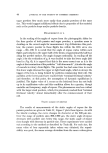
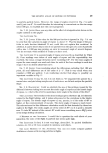
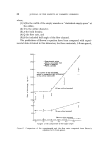
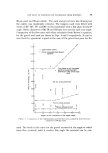
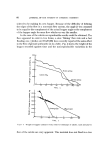
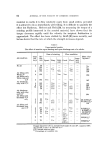
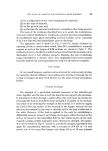
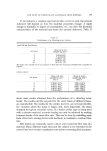
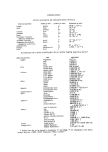
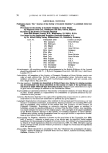
THE CONTINUOUS MIXING OF PARTICULATE SOLIDS 15 mean residence time would change the position of the particles without useful mixing. Since mixing and demixing go on simultaneously in the drum, there will be a critical value of mean residence time for a segregating mixture above which demixing will predominate. It has been predicted (30) that for a prolonged residence time bands of smaller or heavier particles will be formed as in the case of batch mixing. The extent of such segregating zones in the drum has been calculated by Sugimoto, Endoh and Tanaka (32) from the knowledge of mix ratio and size ratio of components and this has been substantiated by their experimentally determined axial dispersion coefficient. However, in many cases this undesirable phenomenon can be controlled by selecting values of the operating variables and thus of the mean residence time. Now since the mean residence time is given by Hold-up Rate of flow the value of the mean residence time can be increased either by increasing the size of the drum which would necessitate a large drum or by reducing the rate of flow, which would lower the throughput of the system. RESULTS AND DISCUSSIONS Effect of rate of flow on residence time distribution (components with equal particle size) The average rate of flow can be varied from run to run {a) by changing the feed interval using the same amount of material in feed batches in each case, or (b) by changing the amount of material in each feed batch with a fixed feed interval. In this section the second •nethod was followed. Other operating variables were held constant. The amounts of sand fed in every 15s for run numbers 1, 2 and 3 were 7 g, 15.4 g and 30 g respectively. The amount of tracer used in each case was equal to the size of the respective feed batches i.e. 7.0 g, 15.4 g and 30.0 g respectively and was fed in place of one of the sand batches. Results of these runs are shown in Fig. $ (a) and the corresponding cumulative fractions Vs time are shown in Fig. $(b). The physical constants are tabulated in Table I. Figs. $(aj and $(bj show that at the lowest rate of flow only 40% of the tracer material was found in the outflow even after a lapse of time of twice the mean residence time the corresponding values for flow rates of 1.02 g s- 1 and 1.95 g s- 1 were 78% and 99% respectively.

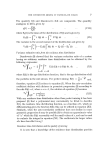
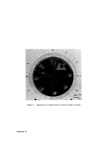
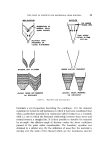
16 JOURNAL OF THE SOCIETY OF COSMETIC CHEMISTS These results show that at a low flow rate an undesirable build up of tracer material takes place in the system. The possible reasons for this phenom- enon are: 8 •.o- o. õ - ix X\x i'... ......, 0 0-5 I-O 1.5 2.0 2.5 Reduced time, t R Symbol Flow rate • 30.0 g in every 15s •x m 15.4 g in every 15s •e• 7.0 g in every 15s Figure 3(a), Effect of flow rate on residence time distribution (c-curves) (a) In spite of the equal particle size of the component and the tracer they segregate in the system due to difference in other physical proper- ties, such as density, particle shape and coefficient of friction the higher the mean residence time the greater is the extent of this segregation. {b) Due to differences in the flow patterns of the components near the outlet, the trace material lies below the surface and does not reach the outlet weir. {c) The amount of the tracer material used in each case, being equal to the size of the respective feed batch, was not constant in every run. The system may not be linear, i.e. the law of super-position may not be
Purchased for the exclusive use of nofirst nolast (unknown)
From: SCC Media Library & Resource Center (library.scconline.org)