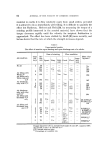
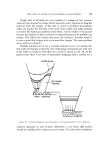
THE CONTINUOUS MIXING OF PARTICULATE SOLIDS number of individual beakers. The contents of each beaker were fed through a chute into the drum at an interval of 15 s, unless otherwise specified. This operation was continued for sufficient time to ensure that the system was at steady state. This technique of feeding gave a system which is inter- mittent in inflow but continuous in outflow, so that during each cycle in the filling operation both hold-up in the drum and rate of outflow were expected to vary. Since the present system is not expected to conform with any of the ideal models, the knowledge of internal and exit age distribution function will be utilized in assessing the performance of the system. There are a number of indirect techniques usually called stimulus response techniques, to obtain these distribution functions. In all cases a disturbance is given to the system and the response to this input signal is measured. These techniques are as follows: Random input signal In this technique either a random fluctuation in the concentration of tracer in the incoming stream is given or else, keeping the concentration constant, random fluctuations to the rate of flow of the tracer stream are given. To obtain the age distribution function from the response function complicated mathematical and statistical analyses are necessary but when the system to be studied is non-linear in character this technique is almost indispensable, and has found application in the study of behaviour of heat- exchangers (27) and distillation columns (28). Frequency response In the frequency response method a sinusoidal disturbance is applied to the incoming stream. The amplitude attenuation and phase shift between the signals at the outlet and entrance are measured. The frequency response diagram thus obtained can eventually be transformed into a distribution curve. This method requires elaborate equipment and is impractical for bulk solid system. Step change signal In the step change method a fixed quantity of tracer is added contin- uously to the feed and the response is measured until the exit stream has the same composition as the inlet. The response curve describing the con-

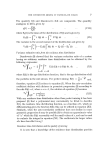
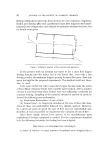
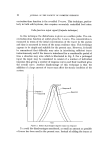
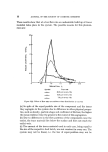
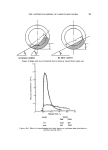
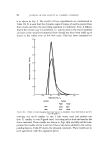
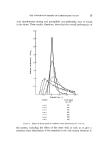
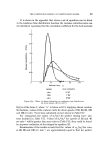
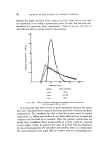
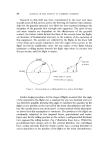
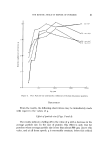
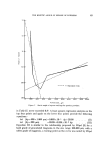
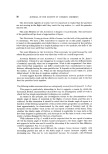
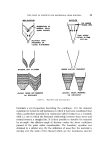
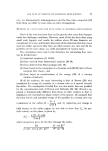
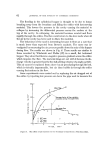
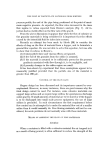
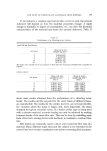
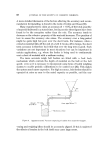
12 JOURNAL OF THE SOCIETY OF COSMETIC CHEMISTS centration-time function is the so-called F-curve. This technique, particu- larly in bulk solid systems, also requires accurately controlled feed rates. Delta-function input signal (Impulse technique) In this technique the disturbance is given as a sudden pulse. The con- centration-time function at outlet gives the C-curve. The concentration is measured in terms of the intial concentration of the tracer in the system and time is measured in terms of the mean residence time. This technique appears to be simple and suitable for the present case. However, it should be remembered that difficulty may arise in introducing sufficient tracer instantaneously and if the tracer is introduced for a considerable period of time a situation may arise which is illustrated in Fig. 2. For a prolonged input the input may be considered to consist of a number of individual impulses thus giving a number of response curves and their resultant gives the overall curve. Another disadvantage of this technique is that the addition of a large amount of tracer may affect the steady condition of the system. o ...Response [ ///x \/j•'-/•._•. Response - / / ',/ [mpulse]I / i /! /// /i/ ,,,'/,,/ -,,,\',,, / / / x \ \ ,/'/11' \'\• \\\ ,,/,/ Time Figure oe. Effect of prolonged impulse input on response To avoid the disadvantages mentioned, as small an amount as possible of tracer has been used in the present case. Instead of adding the tracer at
Purchased for the exclusive use of nofirst nolast (unknown)
From: SCC Media Library & Resource Center (library.scconline.org)