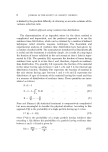
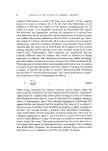
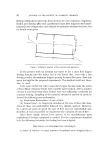
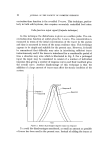
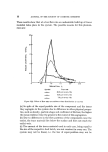
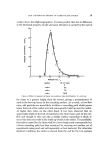
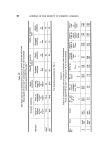
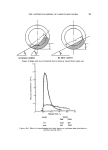
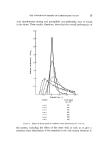
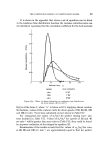
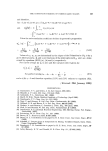
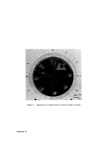
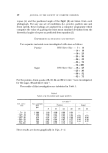
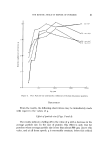
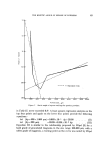
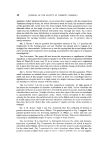
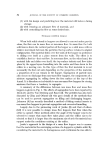
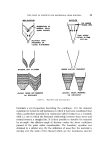
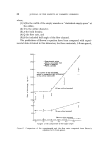
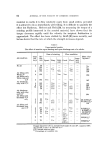
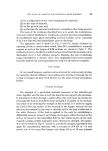
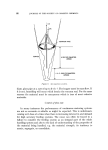
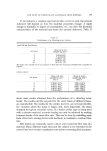
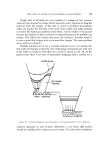
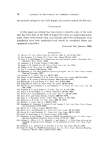
THE FLOW OF PARTICULATE MATERIALS FROM HOPPERS dimensional hopper the material initially flakes away from the bulk of material which does not move. At some point equilibrium is reached and the bulk of the material moves down at a rate equal to the discharge rate and the top of the cavity remains in the same position (Fig. 51. The position of the surface at the top of the cavity is dependent on the state of compaction of the material and is not reproducible. BO ø HOPPER '•' 0 80 ø , IS2 mm ORIFICE ß [1 [] 80ø• 76 mm ORIFICE E I ', ß 45ø• IS2 mm ORIFICE • • I 4Sø• 76 mm ORIFICE ASSW I .''••- •' • FLOW .•-•-•' ' I , i AIR PRESSURE• kN rn- • BELOW ATHOSPHERIC Figure 6. Pressure profiles in the cone of a hopper during discharge of 66 pm sand.

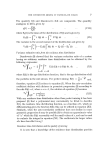
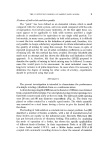
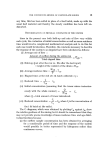
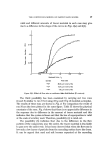
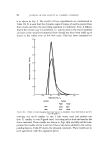
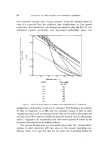
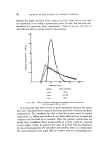
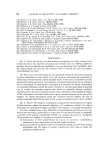
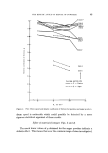
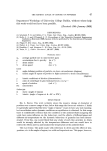
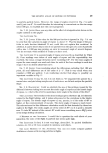
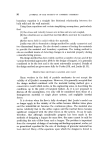
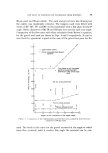
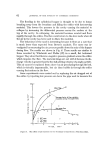
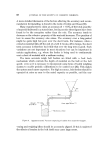
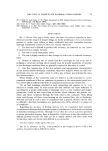
JOURNAL OF TIlE SOCIETY OF COSMETIC CHEMISTS The flooding in the cylindrical hopper is thought to be due to lumps breaking away from the boundary and filling the orifice with fast moving material. This lowers the pressure in the cavity causing the material to collapse by increasing the differential pressure across the surface at the top of the cavity. In collapsing, the material becomes aerated and flows rapidly through the orifice. The flow could return to the slow mode when all the air in the cavity has been used to dilate the material. The behaviour of the sand is interesting because it flows at a rate that is much lower than expected from Brown's analysis. The cause was in- vestigated by measuring the air pressure profile down the axis of the hopper during flow. The results are shown in Fig. 6. These results are similar to those recorded by Wlodarski and Pfeifer (27) in a small, flat bottomed hopper. They show that there is a negative pressure gradient across the orifice which impedes the flow. The material drags air out with it because its dis- charge velocity is greater than the free fall settling velocity of a single particle. This air cannot be replaced from above by air percolating through the bed, which is virtually impermeable, but air does bubble in through the orifice causing fluctuations in the flow. Some experiments were carried out by replacing the air dragged out of the orifice by injecting low pressure air down the pipe used to measure the 47o• o I Mass '•' 300J-- /'• f Average limits of flow variation • / / / 7 recørdedduring •' No a• flow • • • cone o • o 75 ø cone o 8 16 Air rate, train -• Figure 7. The effect of air injection on the discharge of sand from a 76.2 mm orifice.
Purchased for the exclusive use of nofirst nolast (unknown)
From: SCC Media Library & Resource Center (library.scconline.org)